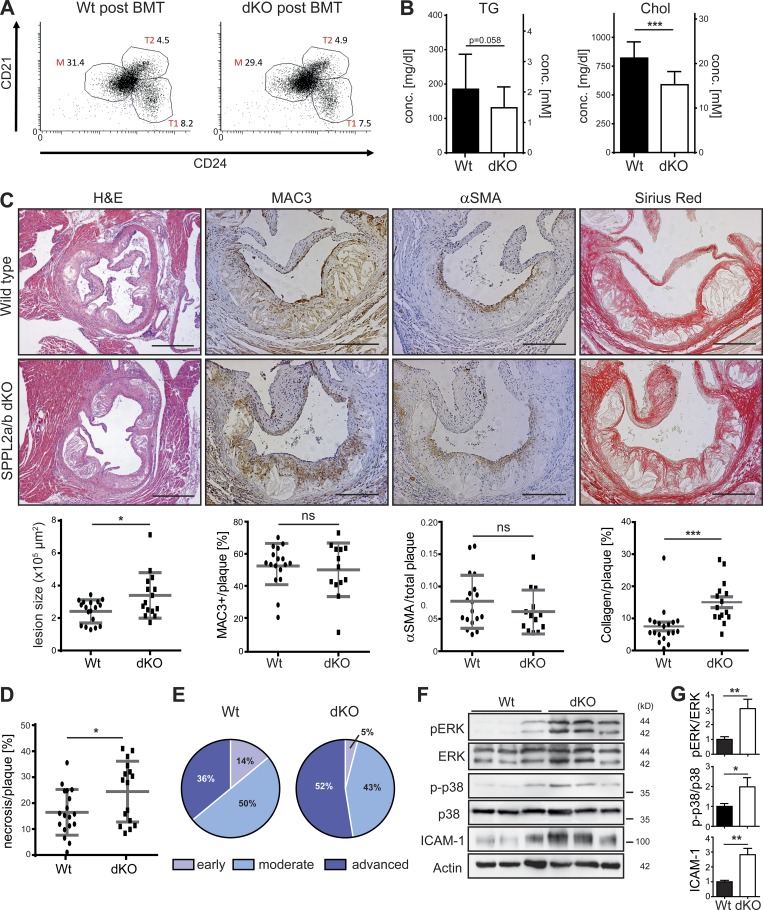
Figure 8.
Enhanced atherosclerosis in SPPL2a/b double-deficient mice. (A–G) Hypercholesterolemia and atherosclerosis were induced in WT and SPPL2a/b-deficient (dKO) mice by adeno-associated viral expression of D377Y-mPCSK9 and an HCD for 9 wk following bone marrow transplantation (BMT) with WT bone marrow. (A) Proportions of transitional stage 1 (1) and 2 (T) as well as mature B cells (% of viable splenocytes) were analyzed by flow cytometry at the end of the atherosclerosis experiment. The dot plots depict viable B220+ splenocytes. (B) Plasma triglyceride (TG) and cholesterol (Chol) levels were determined 3 wk after HCD initiation. N = 2, n = 18–20. (C) Atherosclerotic plaque development was analyzed histologically in H&E-stained aortic root cross-sections. Bars, 400 µm. Plaque macrophage, smooth muscle cell, and collagen contents were quantified based on MAC3, αSMA (alpha smooth muscle actin), and Sirius Red staining, respectively. Bars, 200 µm. N = 2, n = 13–18 (αSMA); n = 13–17 (MAC3), n = 15–18 (size), n = 15–19 (Sirius Red). (D) Quantification of necrotic plaque area. N = 2, n = 16–18. (E) Scoring of atherosclerotic plaques. (F) Activation of ERK1/2 and p38 MAP kinases as well as ICAM-1 levels was compared in atherosclerotic aortae from WT and dKO mice. (G) Quantification of pERK/ERK (N = 2, n = 6), p-p38/p38 (N = 4, n = 11–12) and ICAM-1/actin (N = 2, n = 5–6) ratios. As described in Materials and methods, phosphorylated and total forms of ERK and p38 were detected from the same membranes. After detection of pERK and p38, the respective membranes were stripped and reprobed to detect the total proteins. Student’s t test. ***, P ≤ 0.001; **, P ≤ 0.01; *, P ≤ 0.05; ns, not significant. N, the number of independent experiments; n, the number of individual samples for quantification. All data are shown as mean ± SD.

