Figure 2.
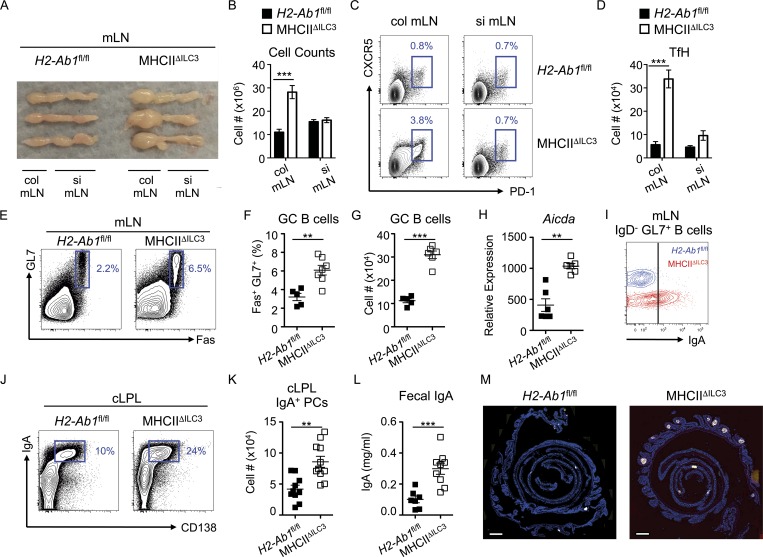
Antigen-presenting LTi-like ILC3 limit the colon-associated TfH–B cell axis and IgA production. (A and B) Images of mLN chains with colon (col) and small intestinal (si) draining lymph nodes indicated (A) and cell counts of colonic or small intestinal draining nodes isolated from RorcCre x H2-Ab1fl/fl mice (MHCIIΔILC3; n = 14) and H2-Ab1fl/fl littermate controls (n = 5; B), representative of at least three independent experiments. (C and D) Representative flow cytometry plots (C) and cell numbers of (live CD45+/CD3+CD4+/CD25−GITR−)CXCR5+PD1+ TfH in colon and small intestinal draining lymph nodes isolated from MHCIIΔILC3 mice (n = 14) and H2-Ab1fl/fl littermate controls (n = 5; D), representative of at least three independent experiments. (E–G) Representative flow cytometry plots (E), cell frequencies (F), and cell numbers (G) of mLN (live CD45/CD3−MHCII+/B220+CD19+)GL7+Fas+ GC B cells isolated from MHCIIΔILC3 mice (n = 7) and H2-Ab1fl/fl littermate controls (n = 5), representative of eleven independent experiments. (H) Relative expression of Aicda by sort-purified B cells (n = 6), pooled from two independent experiments. (I) Representative surface staining of IgA from class-switched B cells from E–G. (J and K) Representative flow cytometry plots (J) and cell numbers of (live CD45+/CD3−MHCII+)IgA+CD138+ plasma cells in the colonic lamina propria (cLPL) isolated from MHCIIΔILC3 mice (n = 11) and H2-Ab1fl/fl littermate controls (n = 10; K); data are pooled from two experiments and representative of four independent experiments in total. (L) Concentration of free IgA measured by ELISA in feces isolated from MHCIIΔILC3 mice (n = 11) and H2-Ab1fl/fl littermate controls (n = 7) and representative of three independent experiments. (M) Histological analysis of B220+ cells in colonic swiss rolls isolated from MHCIIΔILC3 mice and H2-Ab1fl/fl littermate controls (n = 4–5 per group), with three independent experiments. Bars, 1,000 µm. All data shown as mean ± SEM and analyzed by Mann–Whitney U test; **P ≤ 0.01; ***P ≤ 0.001.

