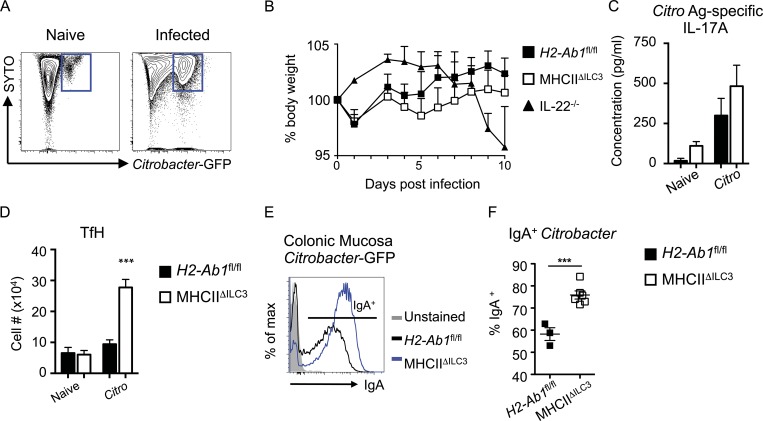
Figure 4.
MHCII+ ILC3 limit IgA responses during C. rodentium infection. (A) Example flow cytometry of colonic mucosal–associated bacteria from naive mice or mice infected with C. rodentium–GFP. (B–D) Weight curves (B), antigen (Ag)-specific IL-17A production (C), and mLN TfH cell numbers (D) of C. rodentium–GFP-infected MHCIIΔILC3 (n = 11) and H2-Ab1fl/fl (n = 5) mice, representative of three independent experiments. (E and F) Example flow cytometry plots (E) and quantification of IgA labeling of C. rodentium–GFP isolated from the colonic mucosa of MHCIIΔILC3 (n = 6) and H2-Ab1fl/fl (n = 3) mice (F). Representative of two independent experiments. All data shown as mean ± SEM; statistical analyses by Student’s t test; ***P ≤ 0.001.

