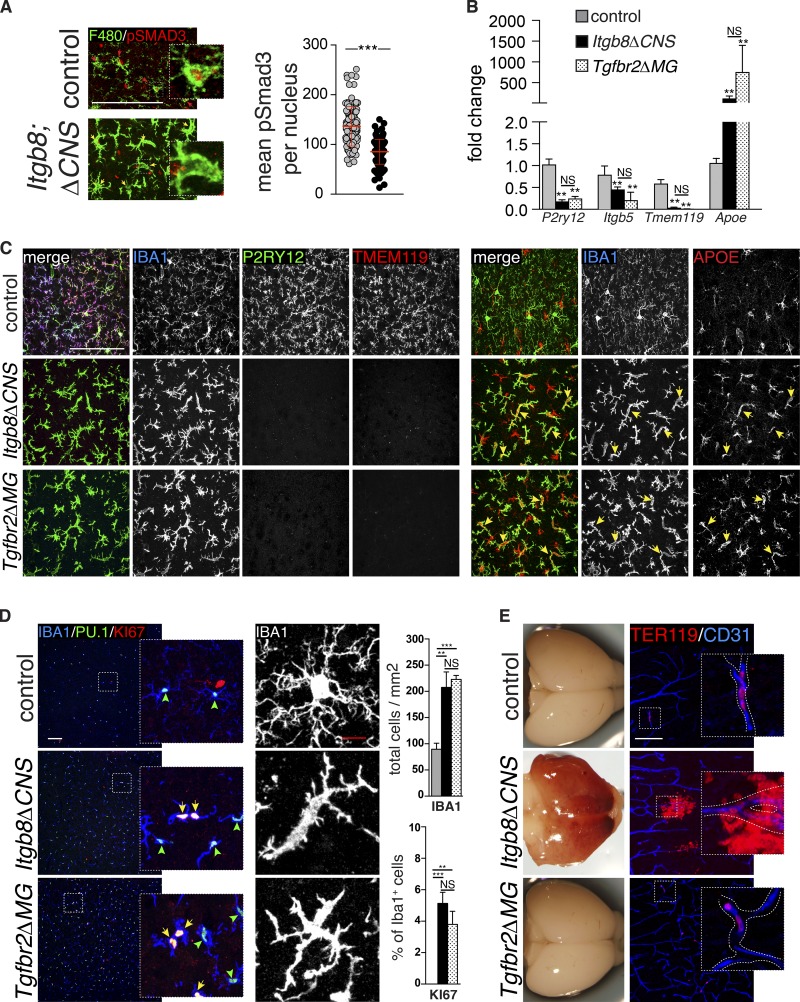
Figure 1.
αVβ8 and TGFβ signaling to microglia. (A) Immunostaining for pSMAD3 (red) in microglia (F4/80, green) reveals reduced pSMAD3 staining intensity (yellow arrows) in most microglia from Itgb8ΔCNS mice compared with intense staining (red arrows) in controls; quantified on right: pSMAD3 staining intensity within individual microglia (arbitrary units) documents reduced microglia-specific pSMAD3. See Fig. S1 for pSMAD staining intensity in other CNS cell types. (B) Transcriptional profiling (quantitative PCR) of sorted microglia documents alterations in several TGFβ-dependent genes, confirmed by immunostaining (C). See Fig. S2 for sorting strategy. Note expression of APOE in IBA1-negative astrocytes. (D) Increased number and proliferation (KI67+) and activated morphology in IBA1+PU.1+ microglia from Itgb8ΔCNS and Tgfbr2ΔMG mice; quantified on right (we did not observe KI67+IBA1+ cells in the cortex of control animals at this time point). (E) Developmental brain hemorrhage in Itgb8ΔCNS but not Tgfbr2ΔMG mice, as evidenced by gross examination and immunostaining for red blood cells (TER119, red) outside of blood vessels (CD31, blue). Bars, 50 µm (A); 100 µm (C–E). Error bars indicate SE. **P < 0.005; ***P < 0.0005. Student’s t test (A) or ANOVA with Tukey’s post hoc test (B and D). n = 4 animals (P60) for all groups.

