Figure 5.
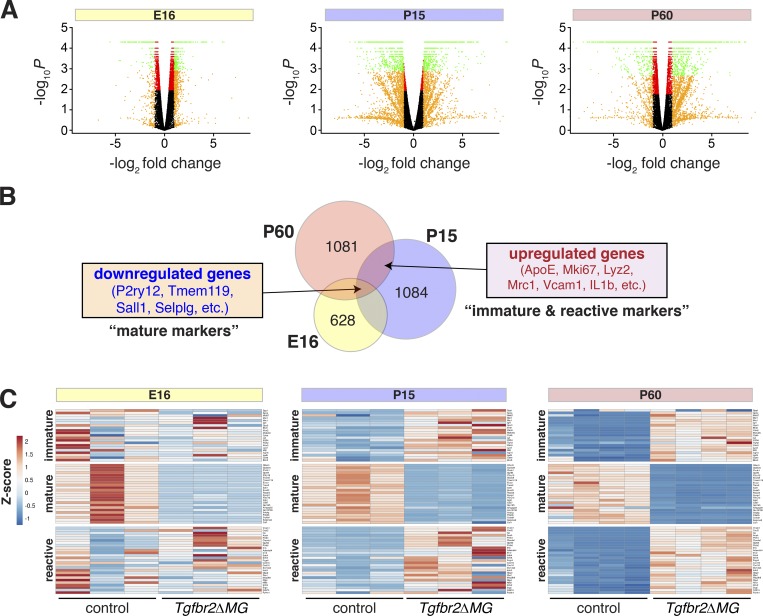
Microglial dysmaturation in the absence of TGFβ signaling. (A) Volcano plots of differentially expressed genes (RNA sequencing) in microglia from Tgfbr2ΔMG versus litter mate controls at indicated time points (n = 3–4 per genotype). Green, P < 0.05 and log2 fold change >1; red, P < 0.05; orange, log2 fold change >1; black, P > 0.05. (B) Venn diagrams of overlaps of differentially expressed genes from E16 (yellow), P15 (blue), and P60 (pink) time points. (C) Heat map representation of differential expression Z statistics for indicated datasets. Genes are divided into immature, mature, and reactive groups based on similarity to published data (see Table S1).

