Figure 6.
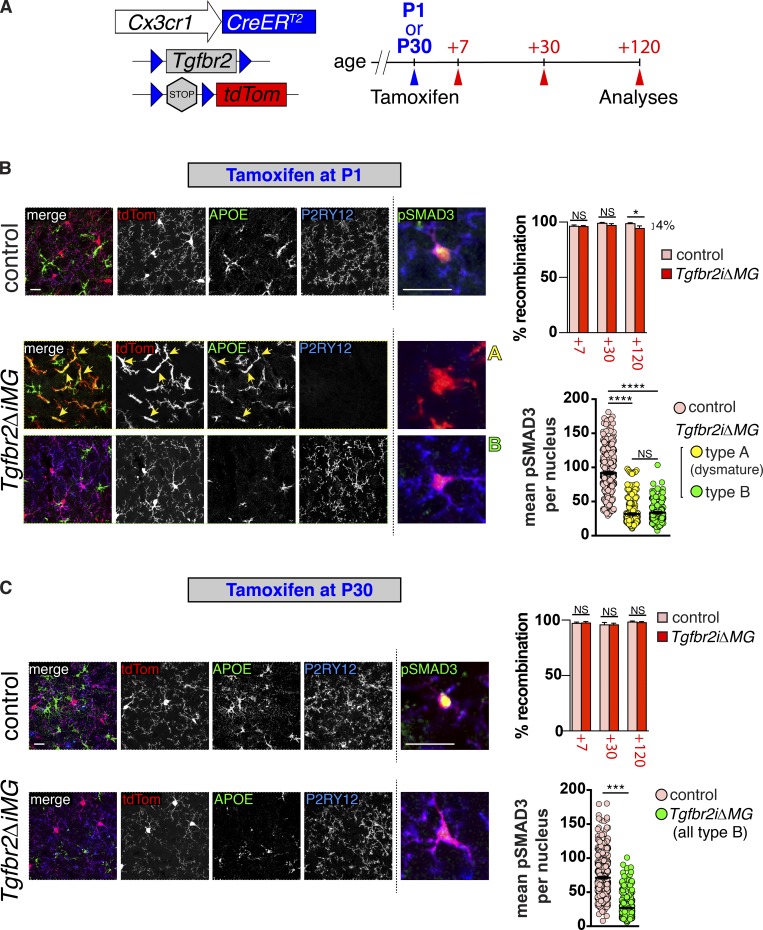
Microglial dysmaturation due to loss of TGFβ signaling is critically time dependent. (A) Diagram of Tgfbr2 gene inactivation and mutant analysis. Tamoxifen was injected at P1 for early induction in B or at P30 for adult induction in C. Mice were sacrificed and analyzed at indicated time points after tamoxifen injection. (B and C) Staining of cortical brain sections from Tgfbr2iΔMG and Cre+ control littermates 120 d after tamoxifen administration following early (B) or adult (C) induction. Left panels: tdTomato recombination reporter (tdTom, red) marks all microglia and immature (APOE, green) and mature (P2RY12, blue) microglia markers to identify type A (dysmature) or type B microglia, respectively. Right panels (insets from Fig. S5): pSMAD3 (green) coimmunostaining reveals reduction in pSMAD3 staining intensity in type A (dysmature) microglia compared with type B microglia and controls. Percent (%) recombination (upper right graphs in B and C) based on % F4/80+, CD45+, CD11b+ cells that are also tdTomato positive (cells isolated and analyzed by flow cytometry as in Fig. S3). Mean pSMAD3 per nucleus (lower right graphs in B and C) based on fluorescent intensity of individual recombined (tdTom+) microglia coexpressing P2RY12 (blue, control and type B cells), or lacking P2RY12 expression (type A cells). Bars, 100 µm or 25 µm (pSMAD3, right panels). Error bars indicate SE. *P < 0.05; ***P < 0.005; ****P < 0.0005. ANOVA with Tukey’s post hoc test (B); Student’s t test (C); n = 4 animals for each group.

