Figure 2.
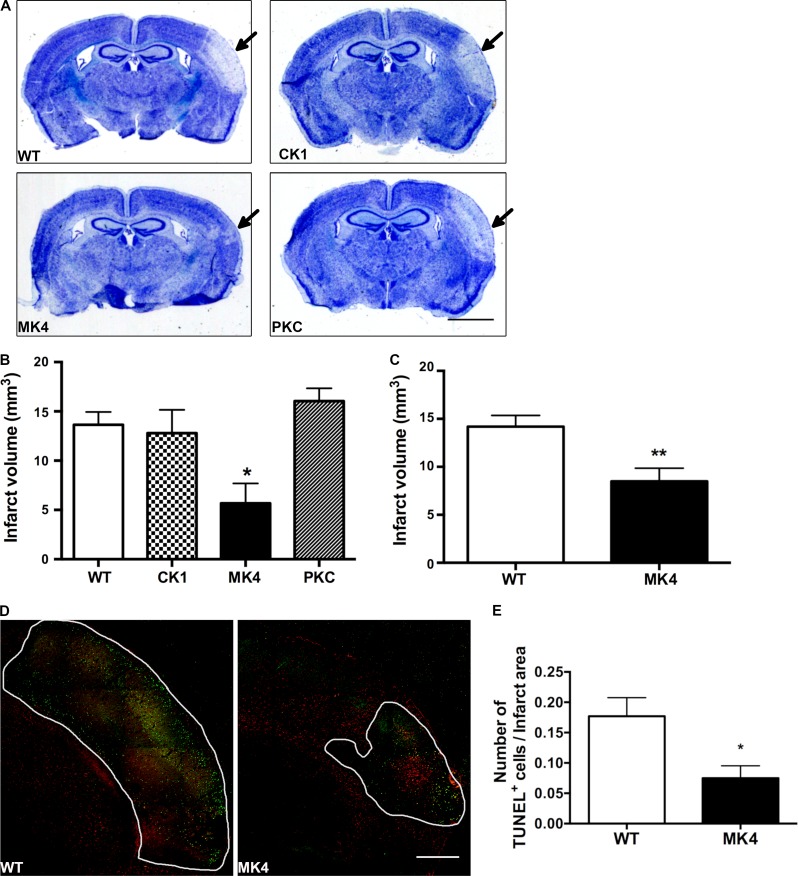
Disrupting the MAPK phosphorylation sites of Cx43 CT decreases infarct volume and TUNEL staining 4 d after pMCAO. (A) Photomicrographs of thionin-stained sections from WT and Cx43-null phosphorylation mutants CK1, PKC, and MAPK (MK4) mice 4 d after pMCAO. Arrows point to infarct region. Scale bar = 2 mm. (B) Quantification of infarct volume from WT and Cx43-null phosphorylation mutants CK1, PKC, and MAPK (MK4) 4 d after pMCAO (one-way ANOVA followed by Bonferroni post hoc test; *, P = 0.0181; WT: n = 5 mice; CK1: n = 4; PKC: n = 4; MK4: n = 4). (C) Quantification of infarct volume from WT and MK4 mice 4 d after pMCAO (unpaired Student’s t test; **, P = 0.0053; WT: n = 10 mice; MK4: n = 11 mice). (D) Coimmunofluorescence staining of cerebral cortex from WT (left) and MK4 (right) mice 4 d after pMCAO using GFAP (red) with a TUNEL apoptosis marker (green). The white outline is the infarct area. Scale bar = 500 µm. Tile Scan tool and auto-stitching algorithm in the Leica LAS AF program was used to create high-resolution image montages. (E) Quantification of average number of TUNEL+ cells in brain sections per infarct area in mm2 from WT and MK4 mice 4 d after pMCAO (unpaired Student’s t test; *, P = 0.0201; WT: four sections, n = 4 mice; MK4: four sections, n = 4 mice). Error bars represent mean ± SEM.

