
Fig. 5.
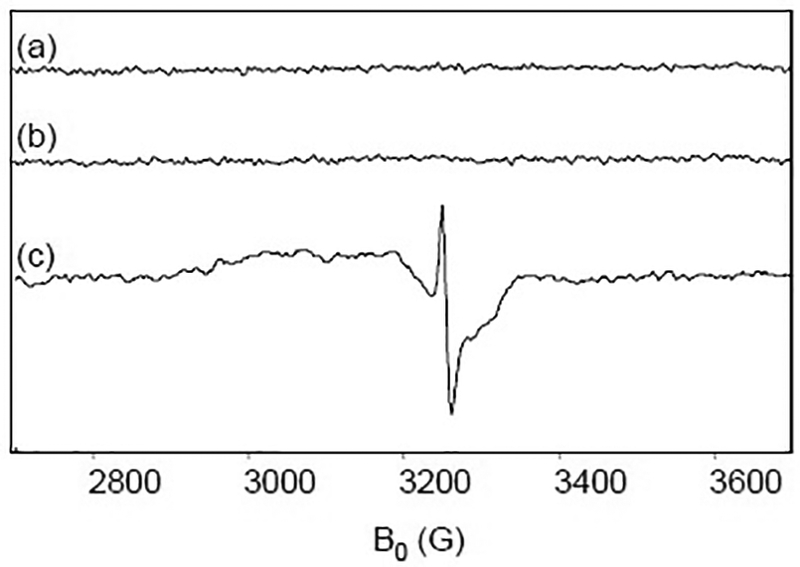
X-band EPR spectra of Cyt c and ascorbate. (a) 5 mM Cyt c is reduced with 5 mM ascorbate and frozen at 77 K at 5 min. (b) 0.5 mM Cyt c is reduced with 10 mM ascorbate and frozen at 77 K at 5 min. (c) 150 μM CcO and 0.5 μM Cyt c are reduced with 10 mM ascorbate and frozen at 77 K at 5 min. The pH of all samples is 7.4. EPR conditions as in Fig. 1.