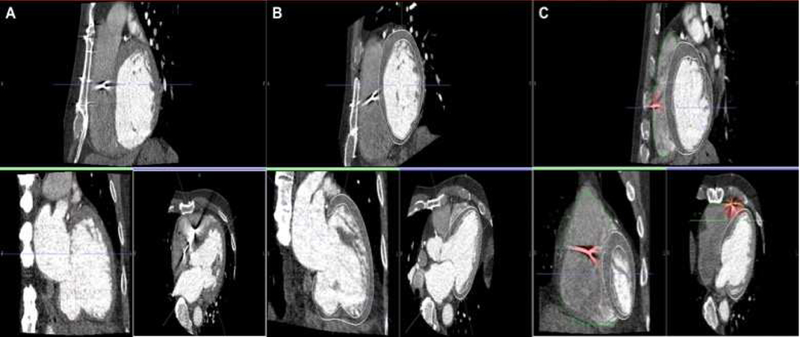
Figure 1. CEP-MDCT images, segmentation, artifact exclusion.

CEP-MDCT segmentation, and extraction of lead artifact areas. Panel A shows CEP-MDCT in coronal, axial and sagittal views. Panel B Shows representative cardiac contouring in each image plane. Panel C shows lead artifact exclusion (highlighted as red).
