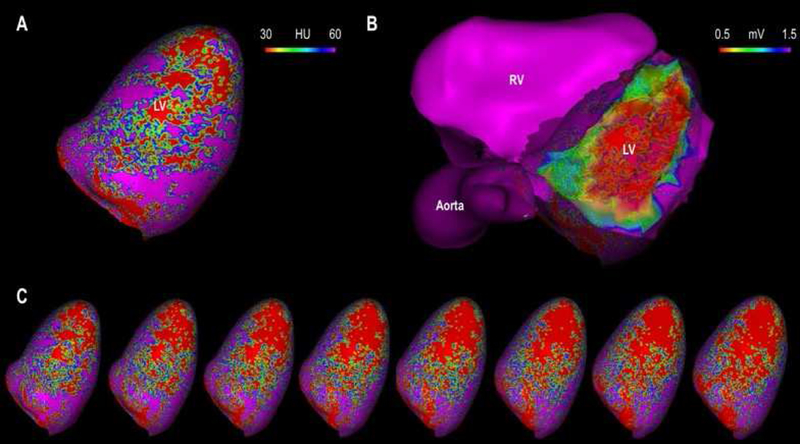
Figure 2. Image registration.

The figure illustrates the process for co-registration of the electroanatomic map to CEP-MDCT reconstructions using landmarks (His bundle, or right aortic cusp) followed by visual and surface registration. Panel A shows a 3D reconstructed CT shell with attenuation color coded for the 10% depth (endocardial) layer of the myocardium. Panel B shows the EAM registered to CEP-MDCT with a transparent CT reconstruction shell for comparison to Panel A. Panel C shows sequential (right to left) CT reconstructions representing attenuation from the 20%, 30%, 40%, 50%, 60%, 70%, 80%, and 90% (epicardial) myocardial depths.
