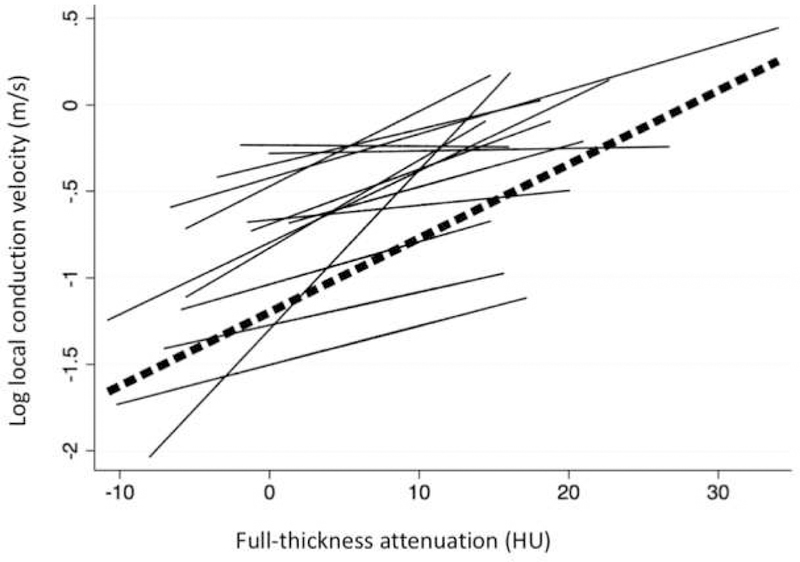
Figure 3. Spaghetti Plot of local CV versus attenuation among individual patients.

Straight lines represent individual regression fits for each patient for the association between full-thickness attenuation and local CV. The dashed line represents the overall association between full-thickness attenuation and local CV.
