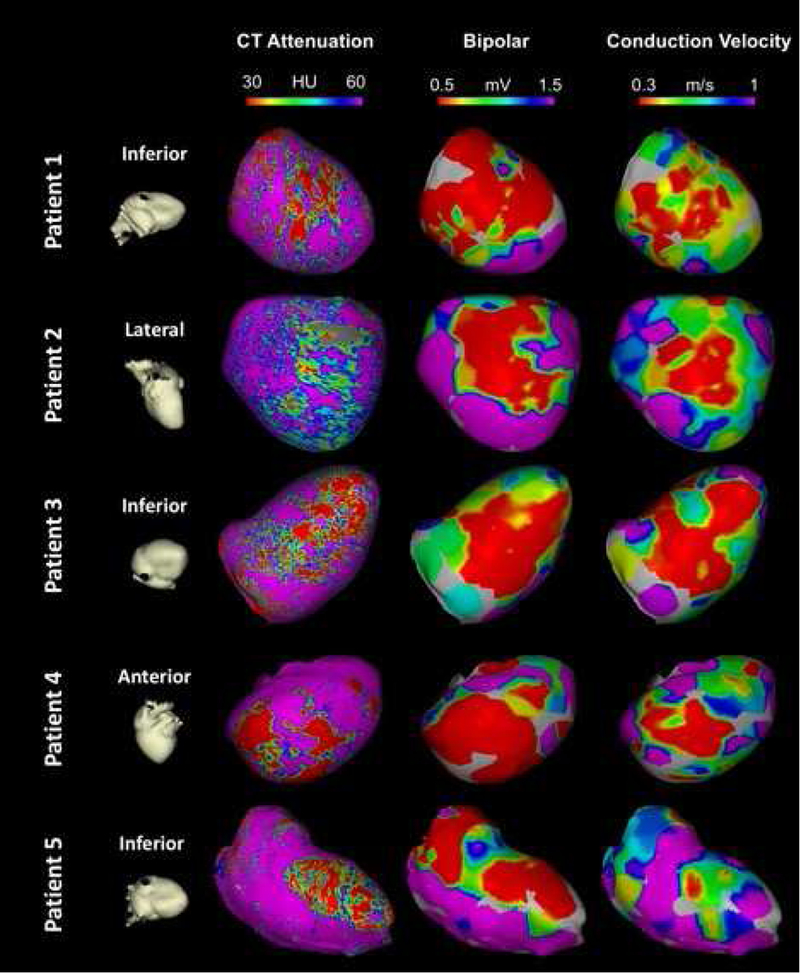
Figure 4. Comparison of Conduction velocity, CEP-MDCT attenuation maps, and Electroanatomic maps in 5 representative patients.

Each row represents a different patient. The first column shows cardiac orientation for the subsequent images in each row. The images in the second column represent endocardial attenuation maps (10% layer). The Gray area in patient 2 has been excluded due to ICD artifact. Images in the third column represent bipolar voltage maps projected on the 3D reconstructed shell from MDCT. Finally, images in the fourth column represent the local CV map projected on the 3D reconstructed shell from MDCT. Of note, the resolution of Panel A is 1194 point/cm3, whereas the resolution of panels B and C is limited by the electroanatomic mapping density at 1.08 point/cm3.
