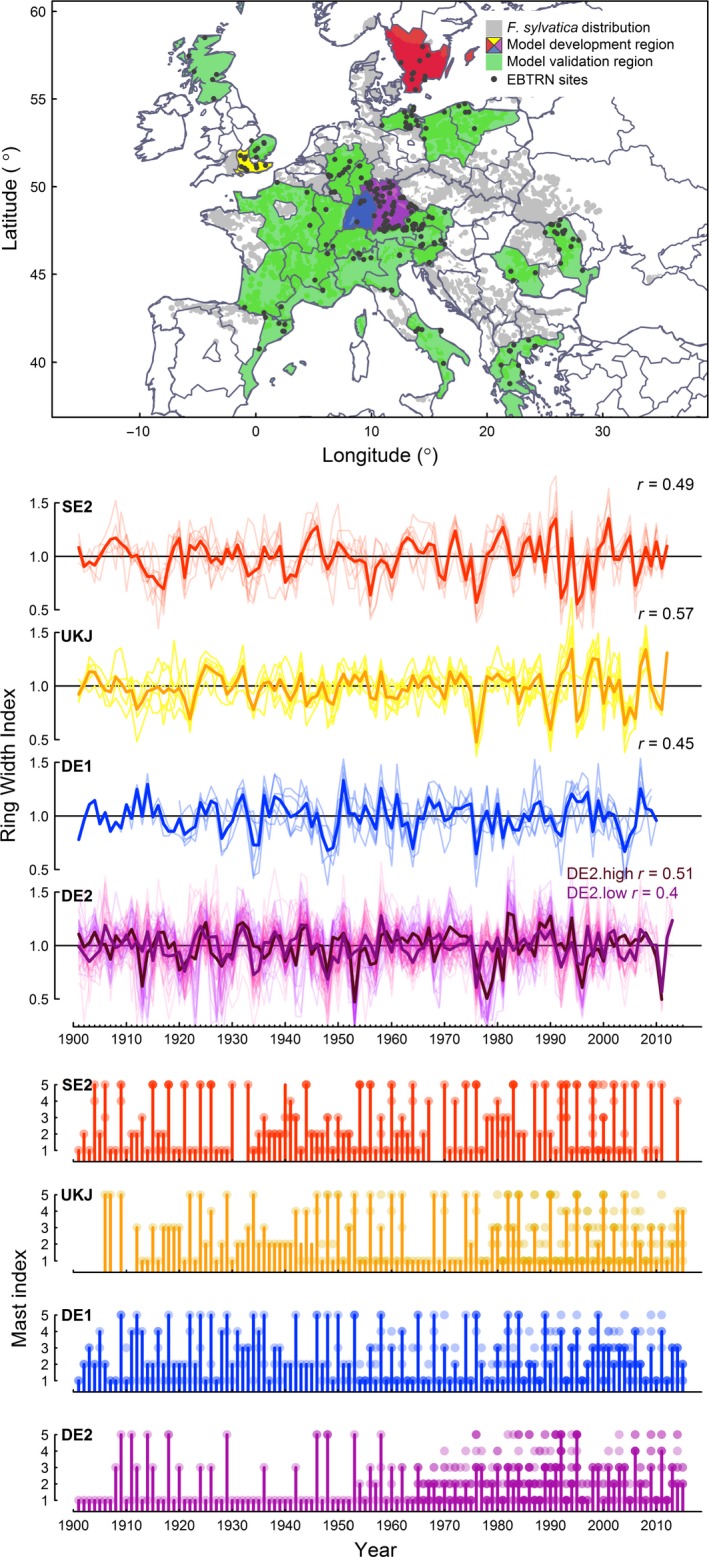
Figure 2.

Study location and summary of data. (a) Study regions (NUTS‐1) including the geographic distribution of Fagus sylvatica (EURFORGEN 2009), and locations of individual RWI chronologies. (b) Ring‐width index chronologies for each region. Individual chronologies plotted in pale colours, and the mean regional chronology in dark colours. r represents the mean correlation between sites in each regional chronology. For DE2, cluster analysis revealed two distinct groups of chronologies, which correspond to high (paler purple) and low (darker purple) elevation (see Appendix B) (c) Annual reproductive effort (RE) (1‐2‐3 = non‐mast year; 4–5 = mast year) of Fagus sylvatica in each region. Individual records are plotted as points (colour intensity represents the number of records in a class), with the modal values plotted as bars.
