
Figure 3.
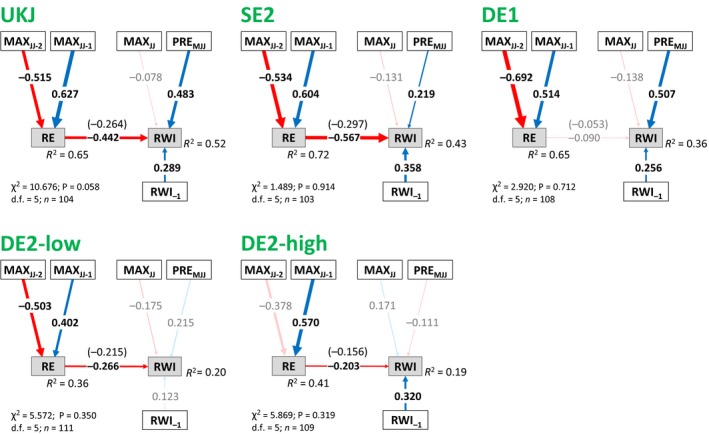
Structural Equation Models for model development and fitting regions, representing the effects of temperature and precipitation on radial growth, with indirect pathways involving the effects of allocation to reproduction (RE). Following mediation analysis, direct pathways from MAXJJ ‐1 and MAXJJ ‐2 to RWI, and from RWI ‐1 to RE, have been removed. Blue and red arrows indicate positive and negative relationships respectively. Numbers on the arrows indicate the standardised path coefficients, with arrow thickness proportional to the coefficient strength. Coefficients in parenthesis refer to raw coefficients. Pale colours indicate non‐significant pathways (P < 0.05). The proportion of explained variance (R 2) for each endogenous variable is also shown.