. 2019 Feb 21;10(13):3779–3785. doi: 10.1039/c8sc04844d

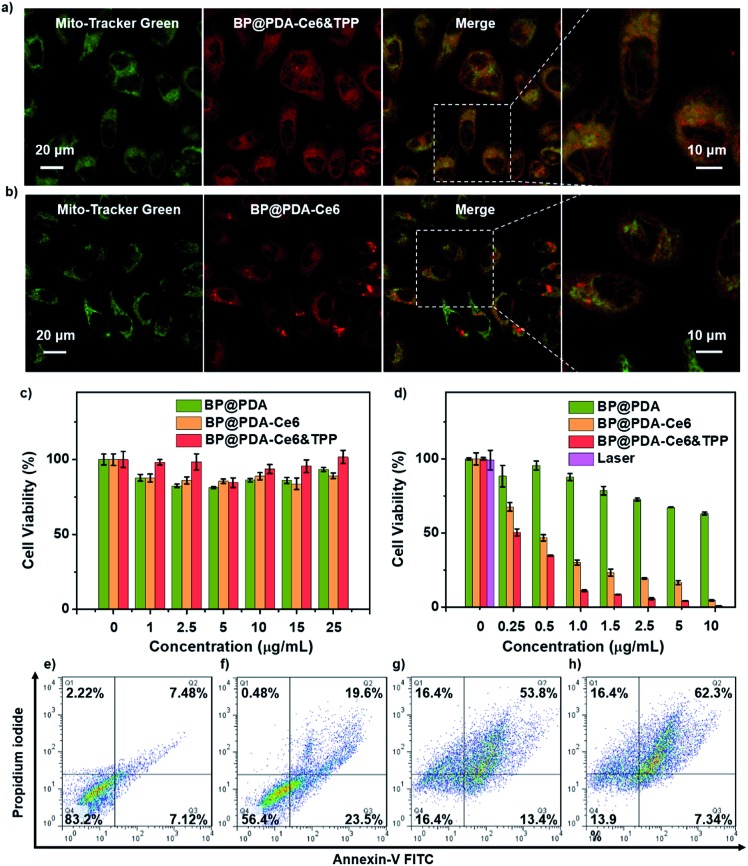
Fig. 4. Confocal fluorescence images of HeLa cells incubated with (a) BP@PDA–Ce6&TPP NSs and (b) BP@PDA–Ce6 NSs (excited at 633 nm) and then Mito-Tracker Green (excited at 488 nm). (c and d) Relative viabilities of HeLa cells incubated with BP@PDA NSs, BP@PDA–Ce6 NSs and BP@PDA–Ce6&TPP NSs at different BP@PDA concentrations (c) without and (d) with laser illumination (660 nm, 0.5 W cm–2, 5 min). Data represent mean ± SD (n = 4). (e–h) Flow cytometry studies of HeLa cells incubated (e) without NSs and with (f) BP@PDA NSs, (g) BP@PDA–Ce6 NSs, and (h) BP@PDA–Ce6&TPP NSs at a BP@PDA concentration of 10 μg mL–1 with irradiation (660 nm, 0.5 W cm–2, 5 min).

Fig. 4