. 2019 Feb 21;10(13):3779–3785. doi: 10.1039/c8sc04844d

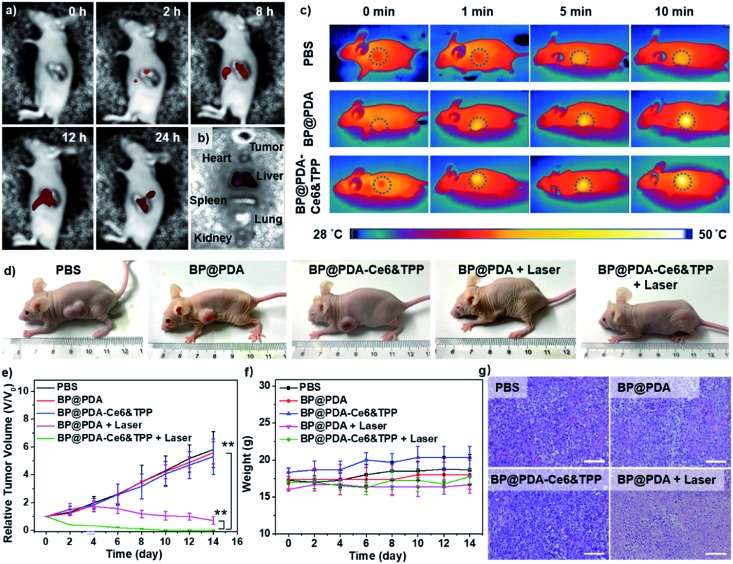
Fig. 5. (a) In vivo fluorescence imaging of tumor-bearing mice after BP@PDA–Ce6&TPP NS injection. (b) Ex vivo fluorescence imaging of main organs as well as tumor at 24 h post-injection. (c) IR thermal imaging of mice after injection of BP@PDA NSs or BP@PDA–Ce6&TPP NSs under laser illumination for 10 min. (d) Photographs of tumor-bearing mice with different treatments. (e) Relative tumor volumes of mice in different treatments as a function of time (n = 4, mean ± SD, **P < 0.005). (f) Body weight of mice during treatment. (g) Histological microscopy images of the tumor tissues stained with H&E after different treatments. Scale bar: 100 μm.

Fig. 5