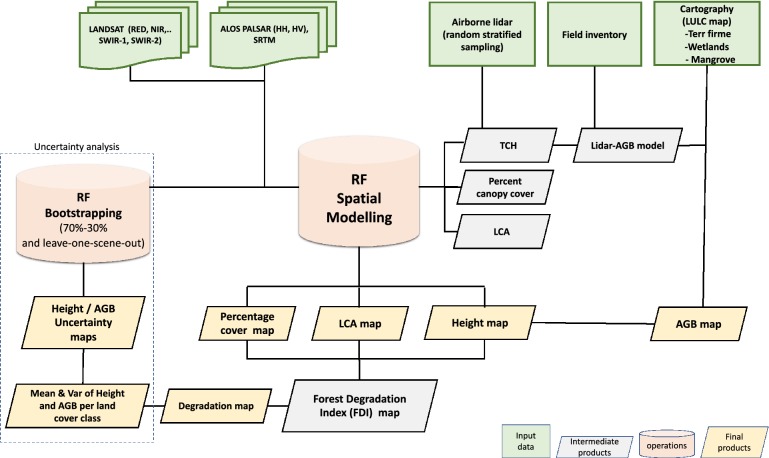
Fig. 1.
Flowchart showing the steps leading to the production of an AGB map. Data inputs are shown in green, intermediate products are shown in grey, while operations are shown in pink and final products in yellow. Operations and products related to the uncertainty analysis are shown in a dashed box. AGB aboveground biomass, TCH mean top canopy height, LCA large trees canopy area

