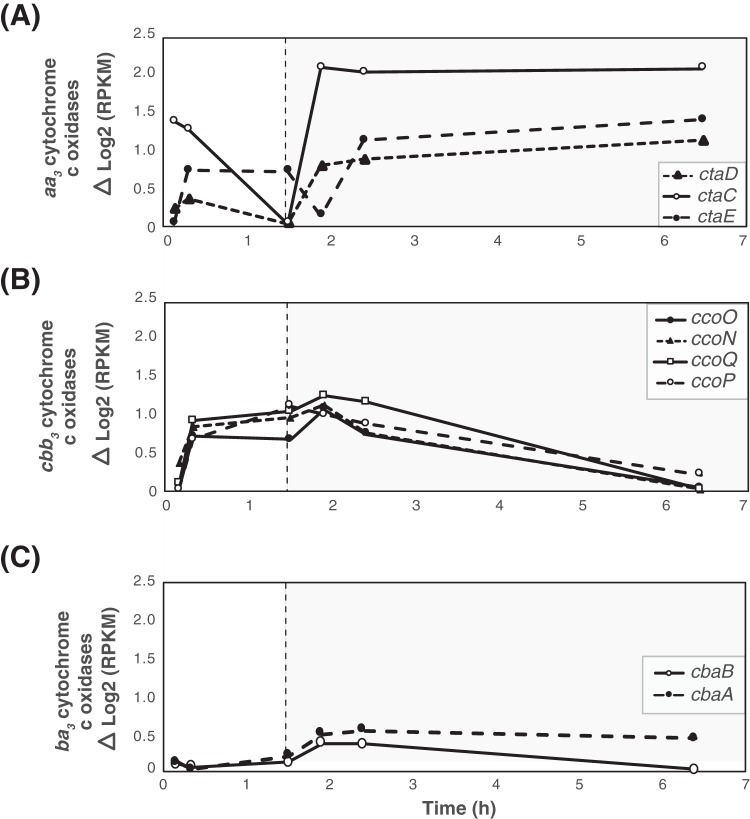
FIG 6.
Gene expression profile patterns of aerobic-respiration-related genes. Data represent the relative levels of transcript abundance of (A) aa3, (B) cbb3, and (C) ba3 cytochrome c oxidases in “Ca. Accumulibacter phosphatis” UW-LDO-IC during the anaerobic (white panel) and microaerobic (gray panel) phases. The expression value corresponding to each time point was normalized to the minimum expression level of each gene over the cycle.

