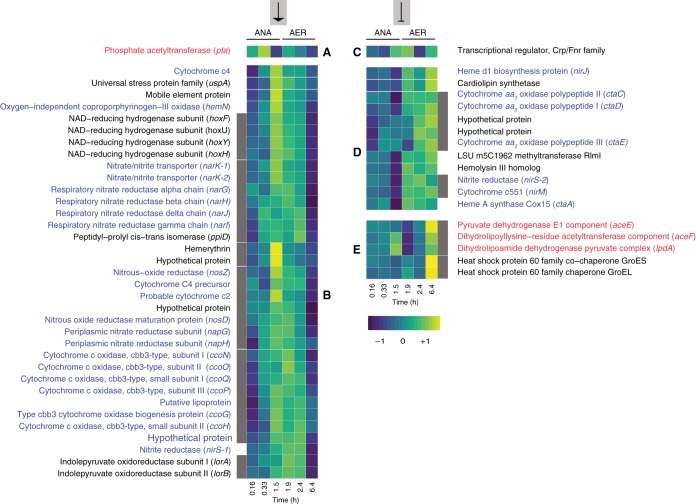
FIG 9.
Transcription profile heat map of members of the FNR regulon in UW-LDO-IC. The colors represent the relative levels of mRNA abundance at each time point of the cycle compared to the mean level of expression (yellow, high expression; dark blue, low expression). Genes were clustered according to their expression profiles. Lateral gray bars indicate genes belonging to the same operon. Groups A and B contain genes whose expression levels negatively correlate with oxygen tension (positively regulated by FNR). Groups C, D, and E contain genes upregulated during periods of high oxygen levels (negatively regulated by FNR). ANA, anaerobic; AER, microaerobic.

