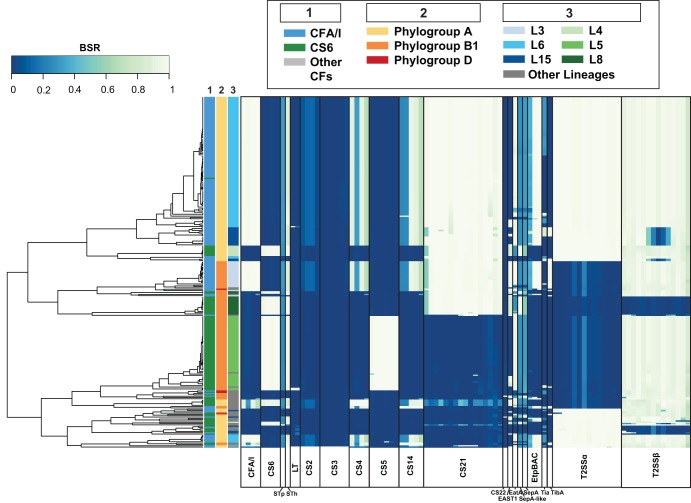
FIG 3.
In silico detection of ETEC virulence genes. ETEC virulence genes that were previously described (60) were detected in each of the ST-only ETEC genomes using BLASTN LS-BSR. Each column represents a gene encoding the specified virulence factors indicated by labels at the bottom of the heat map. Colors of the heat map indicate virulence genes that were detected with significant similarity (light green) or with divergent similarity (blue-green) or were absent (dark blue) in each of the genomes analyzed. Rows represent individual genomes that are categorized on the left by three columns as follows: column 1, colonization factor content; column 2, phylogroup; column 3, ETEC phylogenomic lineage (see inset legend for color designations).

