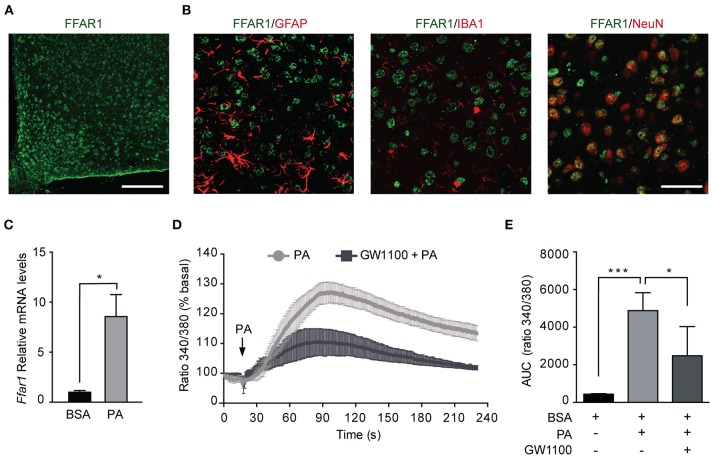
Figure 4.
Palmitic acid activates FFAR1 in N43/5 cells. (A) Representative confocal images showing FFAR1 immunoreactivity in the arcuate (ARC) nucleus of the hypothalamus of male mice. Scale bar: 125 μM. (B) Representative confocal images showing colocalization between FFAR1 and glial fibrillary acidic protein (GFAP), which stains astrocytes, or ionized calcium-binding adapter molecule 1 (IBA-1), which stains microglia or neuronal nuclei (NeuN), which stains neurons, in the hypothalamus. Scale bar: 25 μM. (C) mRNA levels of Ffar1 in hypothalamic tissue in mice gavaged with BSA or PA for 3 days. Data are presented as mean ± SEM. Unpaired t test. BSA, n = 3; PA, n = 4. (D) Representative plot showing the percent increase in intracellular Ca2+ levels induced by PA (100 μM), in the presence or absence of FFAR1 antagonist GW1100 (1 μM). (E) Area under the curves (AUC) represented in (D). Data are shown as mean ± SEM. One-way ANOVA followed by Holm-Sidak's multiple comparisons test. *p < 0.05, ***p < 0.001. n = 4.

