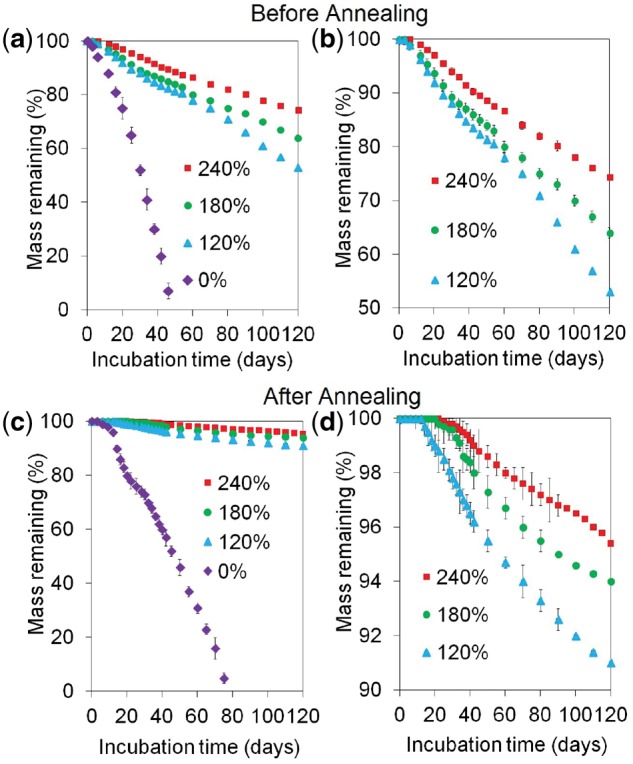
Figure 4.

Mass loss of the cortical scaffolds with incubation time in SBF with 120, 180 and 240 wt% CaP content before (a and b) and after (c and d) annealing; figures (b) and (d) represent the magnified versions of figures (a) and (c), respectively. There was no difference in mass loss of the scaffolds with 240 and 180 wt% CaP as well as those with 120 and 180 wt% CaP. There was a significant difference between the mass loss of scaffolds with 240 and 120 wt% CaP. The mass loss of the scaffolds with 120, 180 and 240 wt% CaP was significantly lower than those with no CaP
