Figure 3.
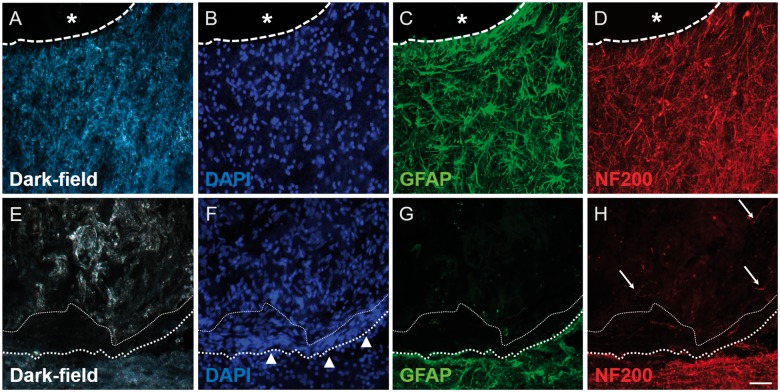
Immunohistochemistry for GFAP and NF200 revealing the tissue interface in lesion-only (A–D) and scaffold-implanted (E–H) animals. (A) Dark-field image and (B) DAPI-stain showing the interface (dashed line) between a fluid-filled cystic cavity (asterisk) and the adjacent intact tissue. (C) GFAP-immunohistochemistry showing the distribution of reactive astrocytes and their processes adjacent to the cystic cavity (asterisk). (D) NF200-immunohistochemistry showing axons located in the same regions as the reactive astrocytes. (E) Dark-field image and (F) DAPI-stain showing the densely cellular band (arrowheads) of the transition zone that forms at the interface between the edge of the implanted scaffold (fine-dotted line) and the adjacent host spinal cord tissue (heavier-dotted line). (G) GFAP-staining reveals that the transition zone is not composed of reactive astrocytes or their processes. (H) Only occasional NF200-positive axonal profiles can be identified within the implanted scaffold (arrows). Scale bar (A)–(H): 50 μm

