Figure 1.
Establishment of the INTACT System for the PCCs.
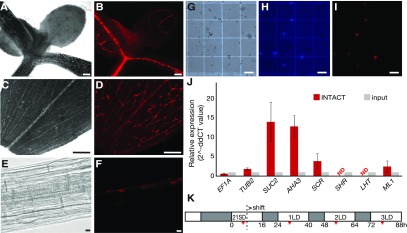
(A) to (B) Microscopy image of the shoot apex of a 7-d-old seedling of the PCC-tagged INTACT line. The shoot apex area was observed (A) in bright field and (B) by mCherry fluorescence. Scale bar = 100 μm.
(C) to (D) Microscopy image of a leaf of the PCC-tagged INTACT line. (C) Leaf area observed in bright field with the main vasculature appearing brighter than mesophyll cells. (D) The RedNTF-tagged PCC nuclei were detected as discontinuous red dots by mCherry fluorescence. Scale bar = 100 μm.
(E) to (F) Microscopy image of root area of a 7-d-old seedling of the PCC-tagged INTACT line. (E) The primary root area was observed in bright field. (F) The nuclear envelope-labeled PCC nuclei were detected by mCherry fluorescence. Scale bar = 10 μm.
(G) to (I) Microscopy images of nuclei purified from the INTACT reporter line. (G) Magnetic beads appear as white spheres in bright field, (H) DNA stained with DAPI is shown in blue, and (I) nuclear envelope domains tagged with RedNTF are detected by mCherry fluorescence. Scale bar = 100 μm.
(J) Relative expression of EF1A, TUB2, SUC2, AHA3, SCR, SHR, LHT1, and ML1 in INTACT-purified PCC-specific nuclei (INTACT) relative to their expression in the input crude nuclei (input) isolated from PCC INTACT reporter lines. Expression of EF1A and TUB2 were used as controls. Error bars = se of the mean values of three biological replications.
(K) Experimental design. Seeds of the INTACT reporter line were geminated on soil and continually grown in SD condition for 21 d and transferred to three consecutive LDs to induce flowering. Light and dark hours are indicated in white and gray, respectively. The time of sample collection (ZT 6 to 7) is indicated with a red bar.

