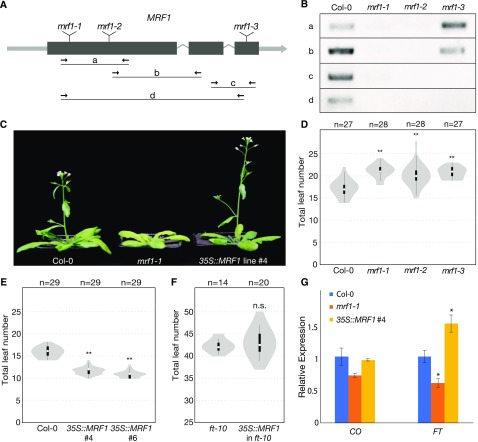
Figure 6.
MRF1 Promotes Flowering.
(A) Gene model of MRF1 showing the positions of mrf1-1, mrf1-2, and mrf1-3 T-DNA insertions and the primer pairs used for RT-PCR analysis.
(B) Detection of MRF1 transcript in wild-type Col-0 plants and homozygous mrf1-1, mrf1-2, and mrf1-3 mutant plants. Plants were grown in 23°C LDs for 8 d.
(C) Flowering-time phenotypes of 4-week-old wild-type Col-0, mrf1-1, and Pro35S:MRF1 plants grown in 23°C LDs. The Pro35S:MRF1 plant is the homozygous T3 generation.
(D) Flowering time of wild-type Col-0 and the three mrf1 mutants grown in 18°C LDs.
(E) Flowering time of wild-type Col-0 and two independent Pro35S:MRF1 homozygous T3 lines grown in 23°C LDs.
(F) Flowering time of ft-10 and Pro35S:MRF1 in ft-10 T1 Plants Grown in 23°C LDs.
For (D) to (F), white circles show the medians, box limits indicate the 25th and 75th percentiles, whiskers extend 1.5 times the interquartile range from the 25th and 75th percentiles, and polygons represent density estimates of data. Numbers of plants are shown above. Significant differences from the control population, calculated using Student’s t test, are shown above each violin plot. **P < 0.01; n.s., not significant.
(G) Expression of CO and FT in 10-d-old Col-0, mrf1-1, and Pro35S:MRF1 plants grown in 23°C LDs. Samples were harvested at ZT15. Data show the mean of three biological replicates, normalized against TUB2 and relative to Col-0, and error bars indicate the se. Significant differences, calculated using Student’s t test, are shown above. *P < 0.05.

