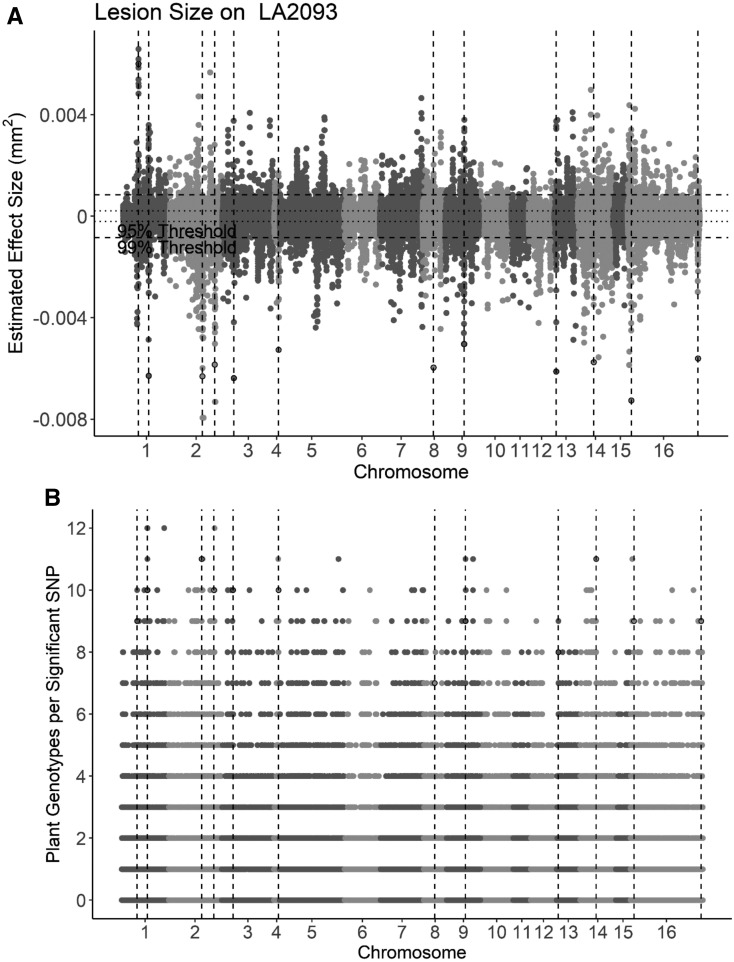
Figure 4.
GWA of B. cinerea Lesion Size on Individual Tomato Genotypes.
B. cinerea chromosomes are differentiated by shading in alternating light and dark gray.
(A) Manhattan plot of estimated SNP effect sizes by bigRR (ridge-regression approach) for B. cinerea lesion size using a single tomato accession, LA2093. Permutation-derived thresholds are shown as horizontal dashed lines.
(B) The number of tomato accessions for which a B. cinerea SNP was significantly linked to lesion development by bigRR using the 99% permutation threshold. Frequency is the number of phenotypes in which the SNP exceeds the threshold. Vertical dotted lines identify regions with overlap between the top 100 large-effect SNPs for LA2093 and significance across the majority (≥6) of tomato genotypes tested.

