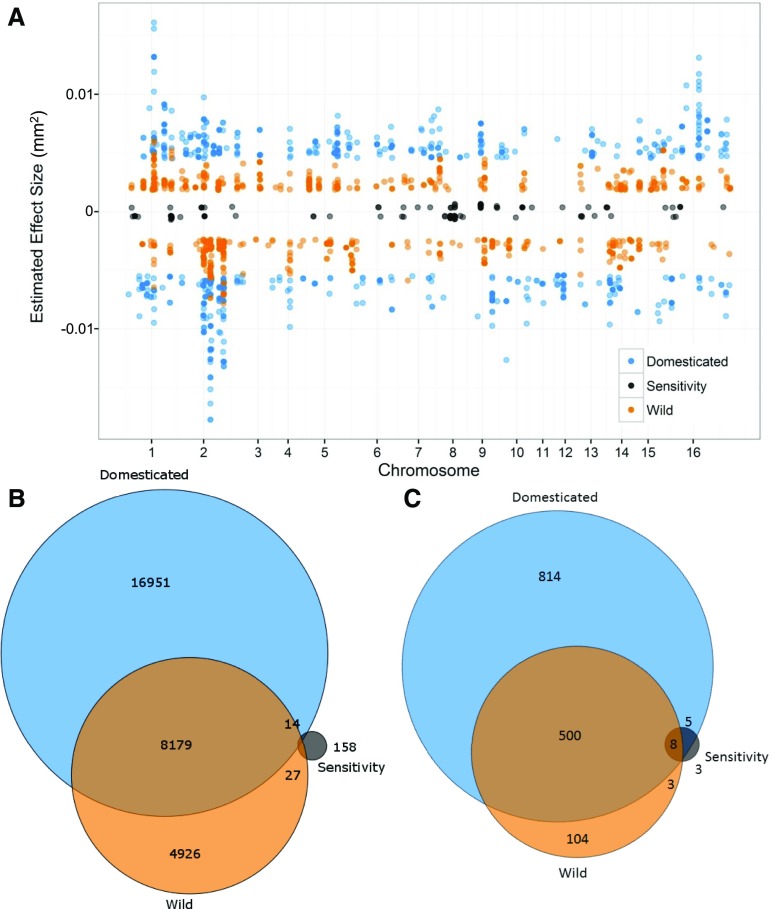
Figure 7.
GWA Analysis of Domestication Sensitivity in B. cinerea.
Domestication sensitivity of each isolate was estimated as the difference between the average virulence on the wild and domesticated tomato germplasm. This value was then used for GWA mapping by bigRR.
(A) The top 1000 SNPs that significantly affect lesion size across domesticated tomato, wild tomato, or domestication sensitivity are shown. Significance is called as crossing the 99% permutation threshold.
(B) Venn diagram of overlapping SNPs identified as crossing the 99% permutation threshold for each trait.
(C) Venn diagram of overlapping genes identified as crossing the 99% permutation threshold for each trait. Genes were called as significant if there was one significant SNP within the gene body or within 2 kb of the gene body.

