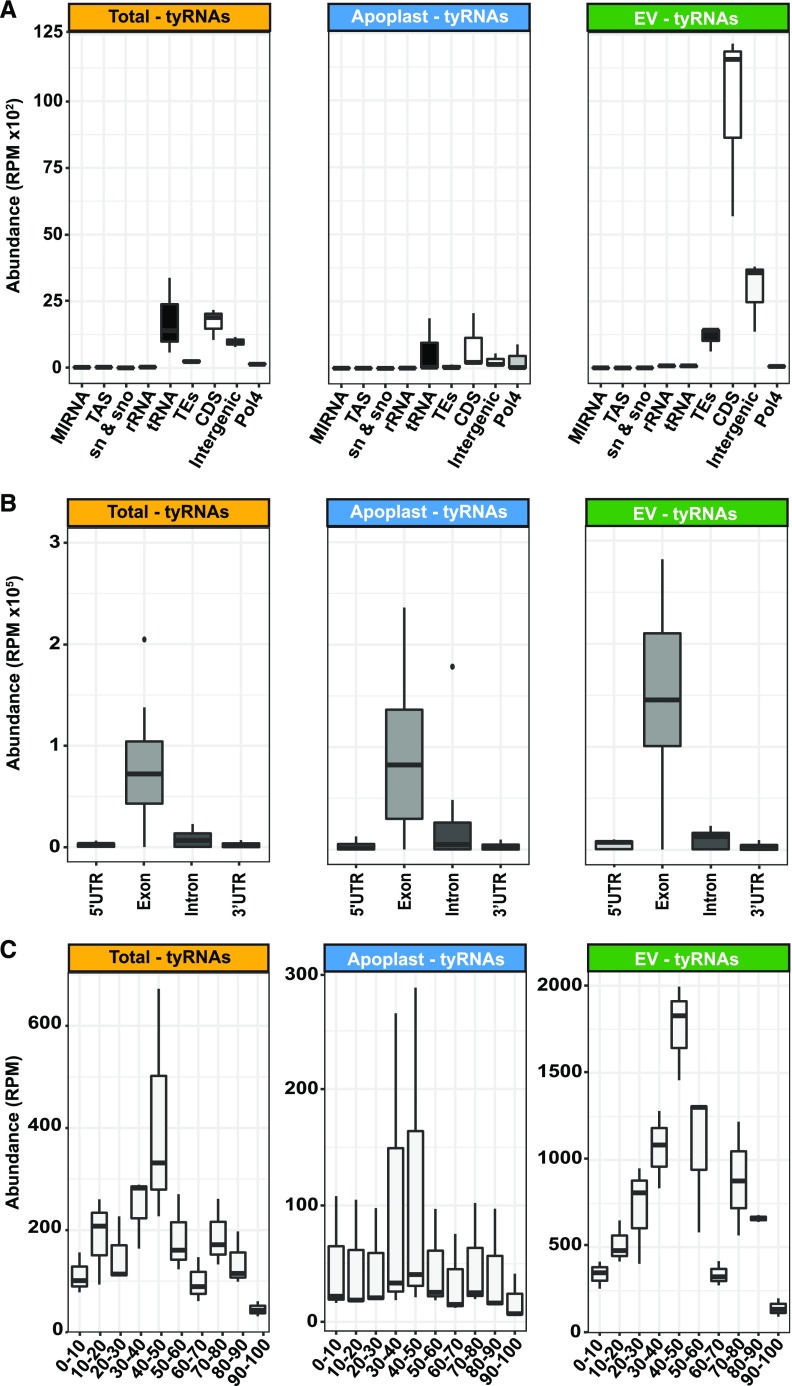
Figure 3.
tyRNAs that Map to a Single Position in the Genome are Enriched in Exon-Derived Sense-Strand Sequences.
(A) The abundance of 1-hit tyRNAs mapping to different features of the Arabidopsis genome. RPM, reads per million.
(B) The abundance of 1-hit tyRNAs mapping to 5′ UTRs, exons, introns, 3′ UTRs, and intergenic regions. The y axis represents abundance, in RPM.
(C) The abundance of 1-hit tyRNAs mapping to different relative positions in mRNAs. The x axis represents the relative position in full-length mRNA, expressed in percentage of the total length, and the y axis represents abundance, in RPM. Note that scales are different for each plot.

