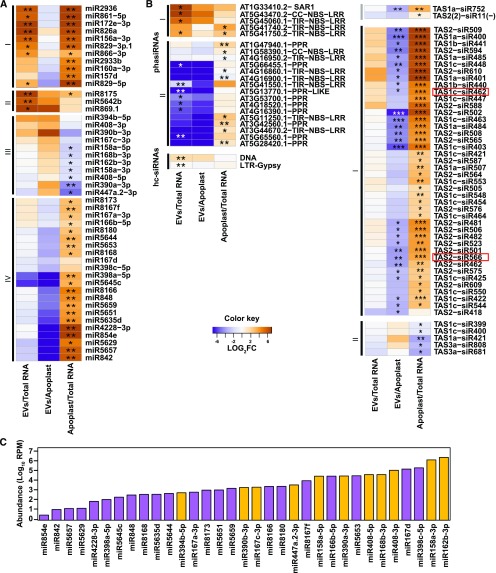
Figure 4.
A Subset of sRNAs Display Differential Abundance in EVs Versus Total Leaf RNA or Apoplastic RNA.
(A) Select miRNAs are enriched or depleted in EVs. Relative abundance of miRNAs in EVs and apoplast compared with abundance in total leaf RNA; the relative abundance is expressed as a heat map (see Key in center), with the samples being compared indicated below each heat map (*Q value ≤ 0.05 and **Q value ≤ 0.01).
(B) Select siRNAs are enriched in EVs. Heat map indicates relative abundance of siRNAs (including phasiRNAs, tasiRNAs, and hc-siRNAs) in the indicated samples. Boxed tasiRNAs indicate sRNAs taken up by B. cinerea (shown in Cai et al., 2018; *Q value ≤ 0.05, **Q value ≤ 0.01, and ***Q value ≤ 0.001).
(C) miRNA abundance does not correlate with EV enrichment. Absolute abundance in EVs of select miRNAs expressed in reads per million (RPM) on a logarithmic scale, including miRNAs enriched in EVs (orange) and those depleted in EVs (purple) relative to apoplastic RNA.

