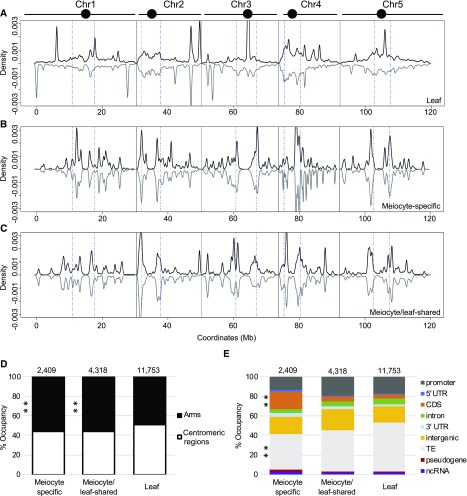
Figure 2.
ms-sRNAs Tend To Localize with Genic Regions Rather than TEs.
(A) Density plot of the distribution of leaf sRNAs on the five Arabidopsis chromosomes (black bars; circles represent centromeres). sRNA density on the sense strand shows a positive value (plotted in black), while sRNA density on the antisense strand shows a negative value (plotted in gray). Chromosomes are portioned into arm regions and centromeric regions (blue dot-dashed lines).
(B) Density plot of the distribution of ms-sRNAs on the five Arabidopsis chromosomes.
(C) Density plot of the distribution of meiocyte/leaf-shared sRNAs on the five Arabidopsis chromosomes.
(D) ms-sRNA clusters are enriched on chromosome arms (**P value < 0.01). Pearson’s χ2 tests were used to compare the percentage of reads mapped chromosome arms versus centromeric regions between leaf and ms-sRNA clusters (χ2 = 30.54, P value = 3.28e-08) and between leaf and meiocyte/leaf-shared sRNA clusters (χ2 = 51.36, P value = 7.68e-13).
(E) ms-sRNA clusters are significantly enriched in genic regions and underrepresented in TEs (**P value < 0.01). Pearson’s χ2 tests were used to determine whether leaf and the ms-sRNA clusters are differentially enriched at several classes of genomic features. Significant differences were observed at CDSs (χ2 = 588.18, P value < 2.2e-16) and TEs (χ2 = 79.20, P value < 2.2e-16).

