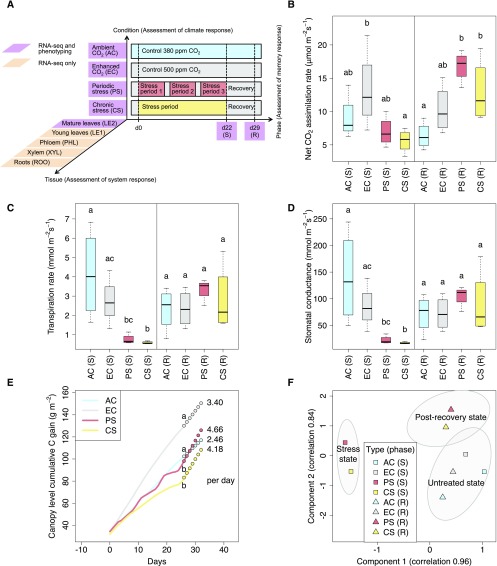
Figure 1.
Effect of Climatic Stress on the Post-Recovery Photosynthetic Performance of Poplar Trees.
(A) The 3D experimental design to investigate the climate response of P. × canescens trees regarding memory aspects and systemic effects. Plants from four environmental conditions including the ambient CO2 control (AC), enhanced CO2 control (EC), periodic drought-heat stress (PS), and chronic drought-heat stress (CS) were examined both at the end of a 22-d stress phase (S; d22) and after one week of recovery (R; d29). At the start of the stress treatment (d0), the plants were 8.5 weeks old and already under AC and EC control climates for 25 d. For fully developed leaves, both phenotypic and transcriptomic measurements are available; for the four other tissues, only transcriptomic data are available.
(B) to (D) Comparison of leaf-level gas exchange rates (leaf No. 9 from the apex) across environmental conditions (center line, median; box limits, top and bottom quartiles; whiskers, maximum and minimum). For each of the two phases (separated by the vertical line), groups that do not share identical lowercase letters are significantly different (Kruskal-Wallis test with post hoc Dunn’s test, Benjamini-Hochberg adjustment, p.adj < 0.05).
(E) Carbon gain determined by online gas exchange analysis for the gas-tight sub-chamber of each environmental condition. The slope (shown by circles) was estimated from the last four measurements (d 26 to d 29). Different lowercase letters indicate a significant difference of slopes (Kruskal-Wallis test with post hoc Dunn’s test, Benjamini-Hochberg adjustment, p.adj < 0.05).
(F) Projection on the top two components from canonical correlation analysis between gas exchange data and log2(TPM+1)-transformed per-gene RNA-seq data of the 100 most varying genes in mature leaves across the four conditions and two treatment phases. Each data point represents the mean of biological replicates for the given group; because of destructive harvesting, stress phase RNA-seq measurements were obtained from biological samples that differed from those used for the continuous gas exchange measurements. Ellipses mark 0.75 confidence levels estimated from the replicates.

