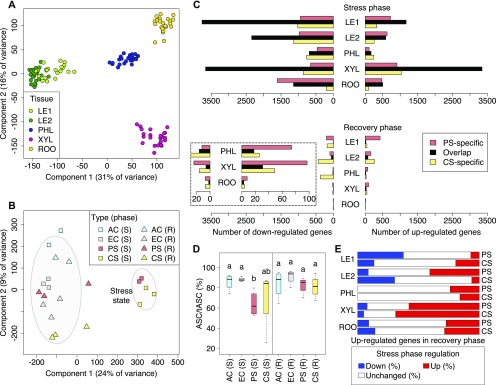
Figure 2.
System-Wide Comparison of Poplar Gene Expression Under Stress, Recovery, and Control Conditions.
(A) Projection on top two components from principal component analysis of log2(TPM+1)-transformed per-gene RNA-seq data from all samples across four climate conditions, two treatment phases, five different tissues, and three biological replicates per group. The biological replicates are tissue samples from different trees subjected to the same environmental condition and harvested at the same time. Data points are colored by tissue (LE1: young leaves, LE2: mature leaves, PHL: phloem, XYL: xylem, ROO: root).
(B) Principal component analysis of poplar trees with complete RNA-seq measurements from all five tissues, concatenating all tissue measurements from the same tree (see Methods). Ellipses mark the 0.75 confidence contour for stressed trees and all other trees (S: stress phase, R: recovery phase).
(C) Number of differentially expressed genes overlapping between PS and CS treatment or unique to each stress type. Differential expression was determined relative to untreated EC controls for each tissue and treatment phase separately (fold change > 2, p.adj < 0.05). The dashed box shows a zoom-in for the three bottommost groups.
(D) Comparison of antioxidant levels in mature leaves across environmental conditions. Groups that do not share identical lowercase letters are significantly different (Kruskal-Wallis test with post hoc Dunn’s test, Benjamini-Hochberg adjustment, p.adj < 0.05). The y axis gives the percentage of functional, reduced ascorbate relative to total ascorbate (oxidized and reduced forms).
(E) Stress-recovery overlap of upregulated genes. For each tissue, the percentage of stress phase down- or upregulation of genes upregulated in the recovery phase relative to EC control plants is given (fold change > 2, p.adj < 0.05).

