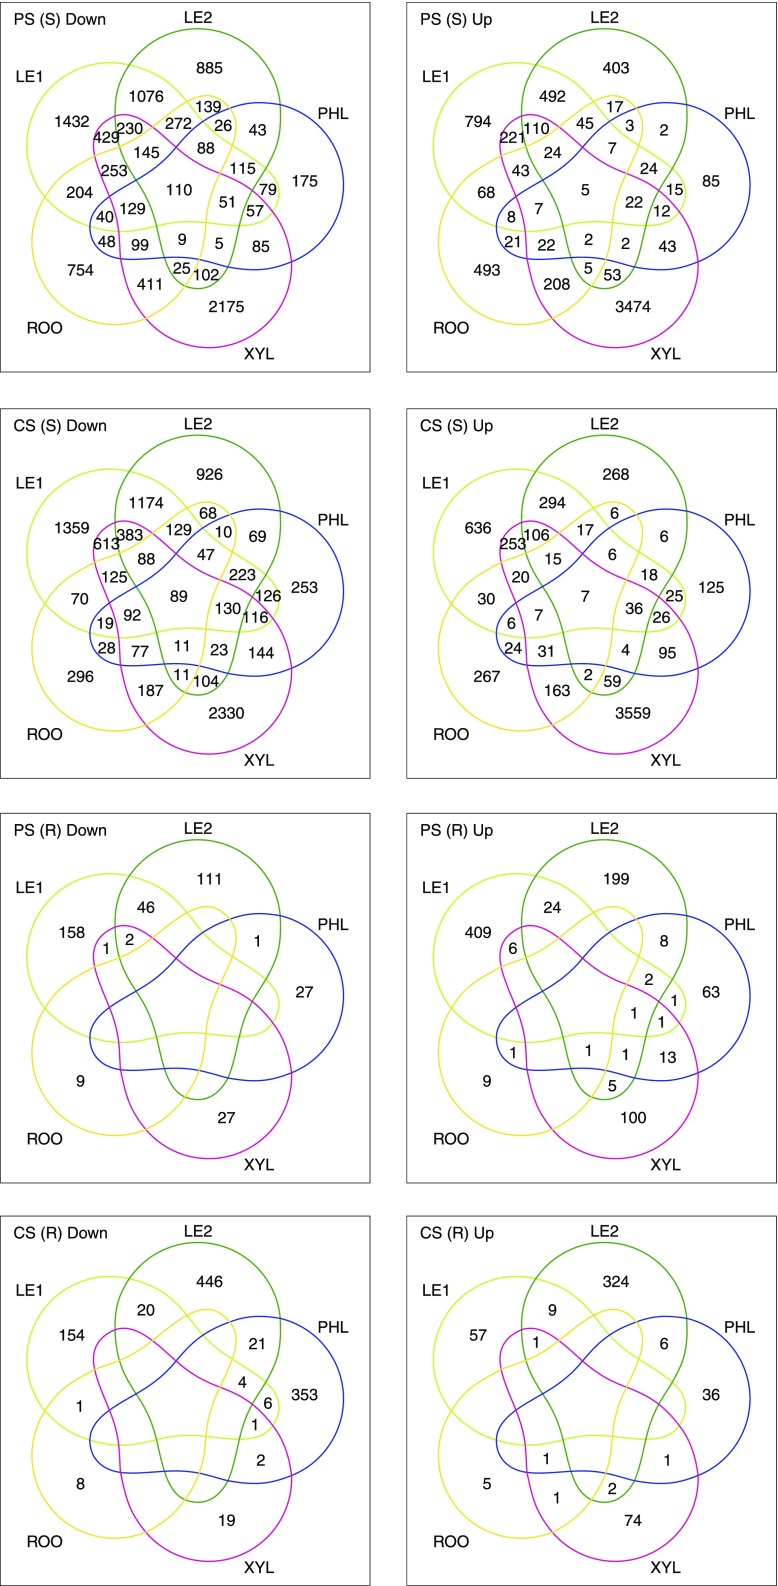
Figure 3.
Tissue overlap of differentially expressed poplar genes during the stress and recovery phases. Each Venn diagram gives the number of up- or downregulated genes for a specific treatment type and a specific phase in comparison with EC controls (LE1: young leaves, LE2: mature leaves, PHL: phloem, XYL: xylem, ROO: root; S: stress phase, R: recovery phase).

