Figure 4.
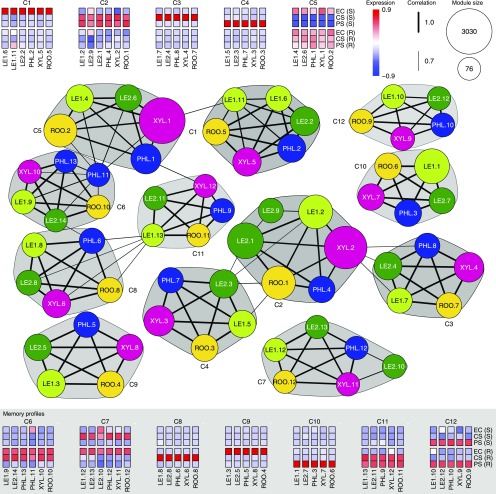
Characteristic poplar gene expression profiles across stress, recovery, and control conditions shared by all tissues. Each network node represents a co-expression module of a specific tissue (see Methods), as indicated by the respective node color (identical code to Figure 2A) and the prefix of the node label (LE1: young leaves, LE2: mature leaves, PHL: phloem, XYL: xylem, ROO: root). Subsequent numbers in the node label identify the module within each tissue in decreasing order of module size, which is indicated by node size. Each module is represented by its eigengene profile, which is the first principal component oriented according to average expression. The correlation of module eigengenes was used to cluster the modules into communities (see Methods). The figure shows all communities that contain modules from all five tissues together with heatmaps of the corresponding eigengenes. Communities are marked by gray polygons and C identifiers (decreasing shades of gray with increasing identifier numbers). For correlation values > 0.7, edges are depicted between module nodes and the edge width represents the correlation strength. The heatmaps with background shading exhibit a pronounced difference between stress-exposed plants and nontreated plants at the end of the recovery phase for at least one stress type, indicative of stress-related memory (S: stress phase, R: recovery phase). Community C9 putatively represents age-related changes that only occur in nonstressed plants.

