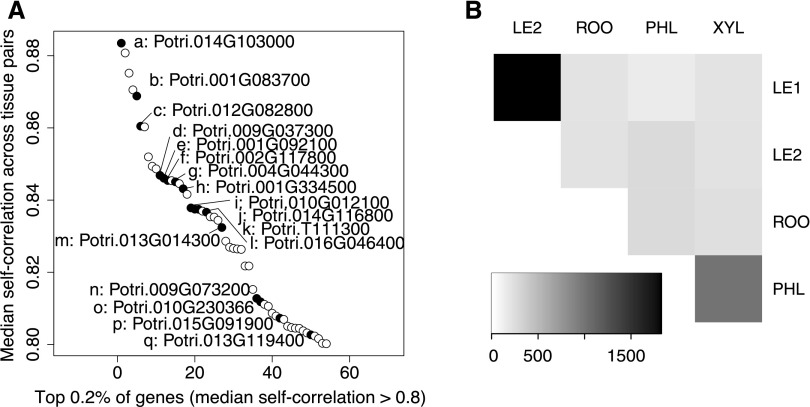
Figure 6.
Expression Self-correlation of Genes Across Tissues Based on Fully Sampled Individual Trees.
(A) The genes with the strongest self-correlation across all tissues. Among them are many genes with periodic stress memory expression patterns in at least one tissue, marked in black and annotated from top to bottom (letters a-q).
(B) Heatmap showing the number of genes (see scale at the bottom) with self-correlation > 0.8 between individual tissues (LE1: young leaves, LE2: mature leaves, PHL: phloem, XYL: xylem, ROO: root).

