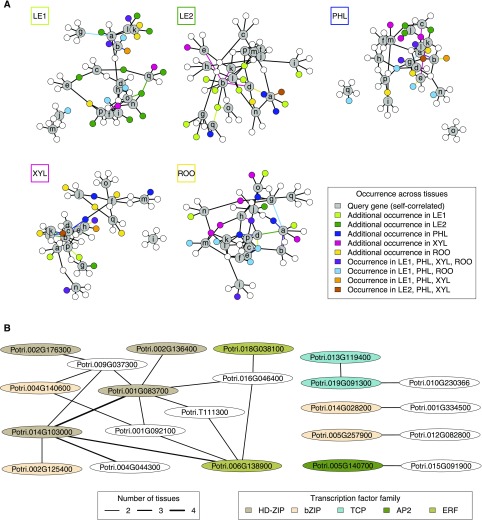
Figure 7.
Gene Regulatory Networks of Stress-Related Multi-Tissue Memory Genes.
(A) Tissue-specific transcription factor networks around self-correlated genes (gray nodes, labeled by letter code from Figure 6A). For each tissue network, colored nodes and edges indicate their co-occurrence across several tissue networks (see color key). If nodes or edges occur only in one additional tissue (except the currently considered tissue indicated in the box at the top left of each network), they have the characteristic color of that additional tissue. For example, ten transcription factors occur only in the networks of both young and mature leaves (dark green and light green nodes in the first and second network, respectively). Likewise, nodes q and o are connected to the same transcription factor in these networks (dark green and light green edges in the first and second network, respectively).
(B) Regulatory relationships co-occurring across tissues. The edge width is proportional to the number of tissues where a specific regulatory relationship was found. Transcription factor nodes are colored according to their transcription factor family. Homeodomain Leu zipper, HD-ZIP. Basic domain/leucine zipper, bZIP. APETALA2, AP2. Ethylene response factor, ERF.

