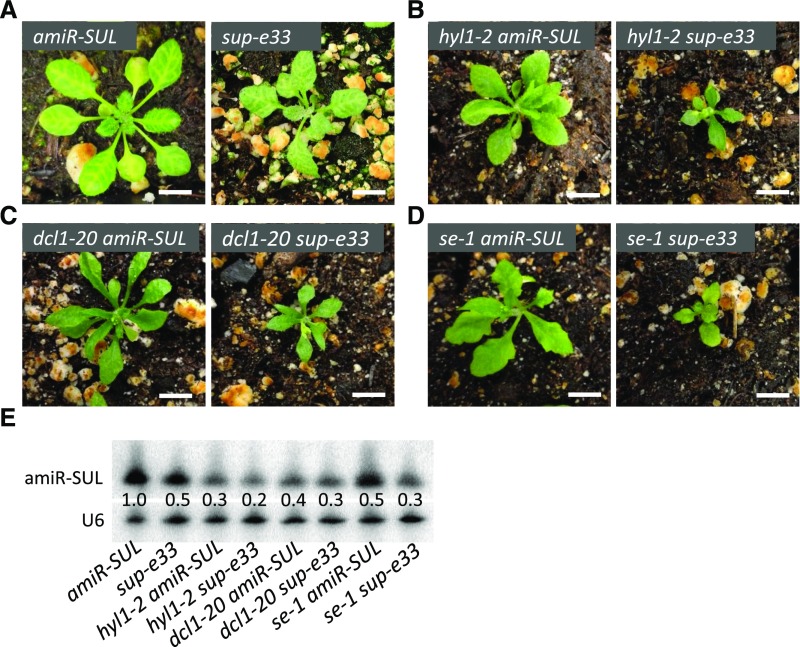
Figure 4.
Genetic Interactions between sup-e33 and Pri-miRNA Processing Mutants.
(A) to (D) Morphological phenotypes of 3-week-old plants of the indicated genotypes. Scale bars = 1 cm.
(E) RNA gel blot analysis of small RNAs to determine the levels of amiR-SUL in various genotypes. U6 served as a loading control. The numbers represent relative abundance.

