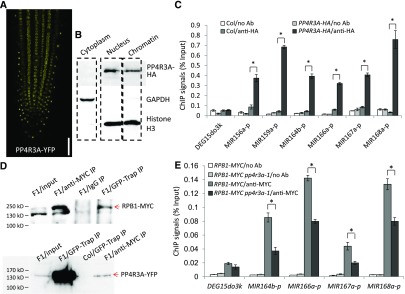
Figure 6.
Analysis of PP4R3A Localization and Pol II Occupancy at MIR Promoters.
(A) YFP signals in the root of a 5-d-old PP4R3A:PP4R3A-YFP seedling. Scale bar = 200 μm.
(B) Protein gel blot analysis showing the cytoplasmic, nuclear, and chromatin distribution of the PP4R3A-HA protein from a PP4R3A:PP4R3A-HA/pp4r3a-1 transgenic line. GAPDH and histone H3 were used as protein markers for the cytoplasmic and nuclear/chromatin fractions, respectively.
(C) ChIP-qPCR analysis to determine the occupancy of PP4R3A at MIR promoters. ChIP was performed with no antibody (no Ab) or anti-HA antibody in Col and PP4R3A:PP4R3A-HA transgenic plants.
(D) Co-immunoprecipitation of PP4R3A with Pol II. F1 plants from a cross between PP4R3A:PP4R3A-YFP and RPB1:RPB1-4xMYC homozygous transgenic lines were used to perform IP, using either anti-MYC or GFP-Trap antibodies. Protein gel blot analysis to detect PP4R3A–YFP and RPB1-MYC was performed with anti-GFP and anti-MYC antibodies, respectively. The protein ladder is labeled on the left.
(E) ChIP-qPCR analysis to determine the occupancy of Pol II at MIR promoters using plants with a homozygous RPB1:RPB1-4xMYC transgene in the Col and pp4r3a-1 backgrounds. The intergenic region DEG15do3k between AT1G28310 and AT1G28320 was used as a negative control. The ChIP signal was normalized against input.
In (C) and (E), error bars indicate sd from three independent experiments; asterisks indicate significant difference (t test, P < 0.05).

