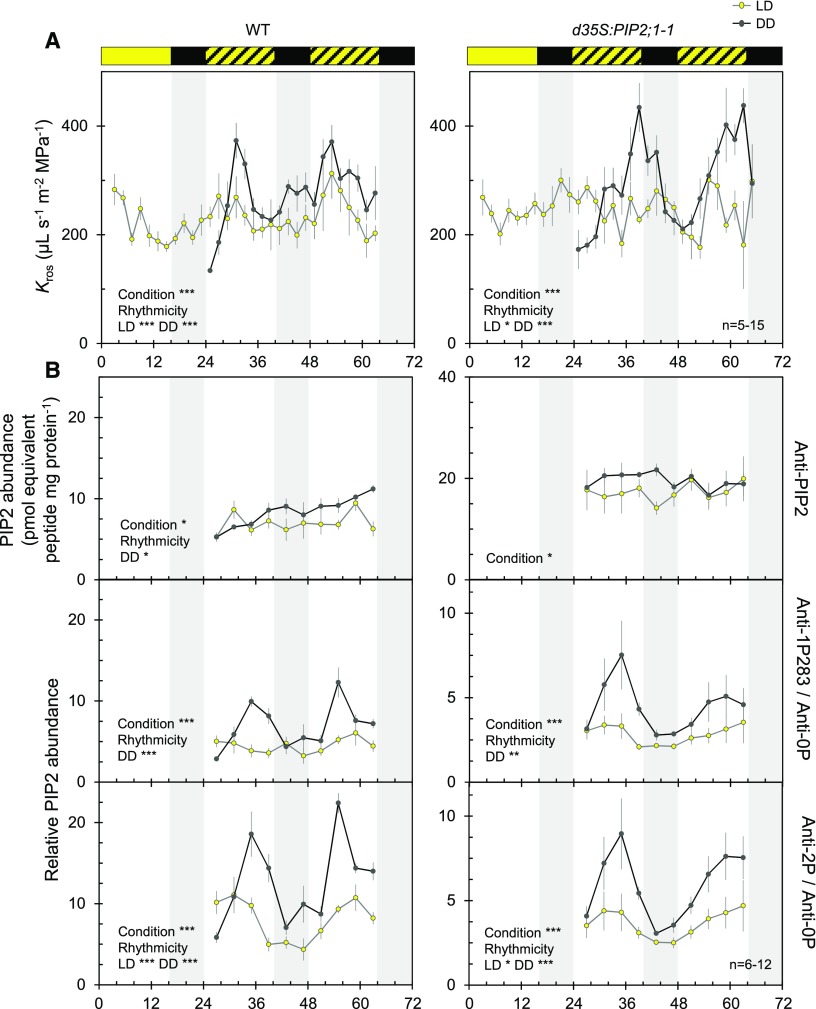
Figure 1.
Circadian Rhythms of Kros and AQP Phosphorylation.
(A) Temporal Kros profiles of wild type (left) and d35S:PIP2;1-1 (right) plants under LD (yellow dots) or DD (gray dots) conditions. Yellow and black bars at top indicate light and dark treatments, whereas hatched bars indicate days and subjective days (dark) under LD and DD conditions, respectively. Plants of the DD series were transferred to an independent dark growth chamber at ZT20. This displacement is thought to disturb the plants and induce a slight drop in Kros, as observed at ZT24. Each point represents an average Kros value (±se; 5–15 plants) per 2 h from 3 independent cultures. Asterisks indicate an effect of a condition based on ANOVA with a dynamic linear model or significant rhythmicity, as determine by analysis with CircWave software (*P < 0.05; **P < 0.01; ***P < 0.001).
(B) ELISA analysis of temporal variation of PIP2 protein abundance (top) and AtPIP2;1-AtPIP2;3 C-terminal phosphorylation (four at bottom) in microsomal rosette extracts. Average signals obtained for each genotype and condition using anti-1P283 or anti-2P antibodies were divided by the corresponding signal of the anti-0P antibody. Cumulative data (mean ± se) from 3 biological (plant cultures) and 2 technical repeats. Experimental conditions, conventions and details on statistical tests as in (A).

