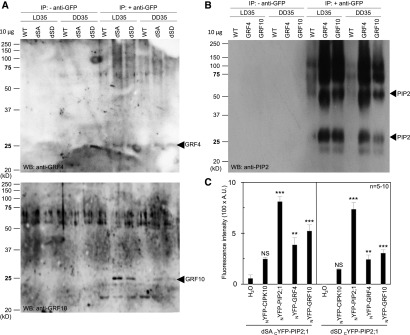
Figure 6.
In Vivo Interaction Between AtPIP2;1 and GRFs.
(A) and (B) Wild type (WT; Col-0) or transgenic plants expressing the dSA or dSD forms of GFP-PIP2;1 (A) or fusions of GFP with GRF4 or GRF10 (B) were cultivated in vitro for 2 weeks before transfer to soil for two additional weeks under LD conditions. Leaves were harvested at ZT35 in plants grown under either condition (LD35, DD35). Immunoprecipitations were performed in the absence (− anti-GFP) or presence (+ anti-GFP) of an anti-GFP antibody. The proteins were further analyzed by protein gel blot (protein gel blot; WB) analysis using anti-GRF4 [(A), top], anti-GRF10 [(A), bottom], or anti-PIP2 (B) antibodies. All lanes were loaded with 10 µg of proteins. Arrowheads indicate the expected molecular weight of monomeric forms of GRF4 or GRF10 (A) or monomeric and dimeric forms of PIP2 (B). The above experiments were repeated twice with similar results.
(C) BiFC analysis of PIP2;1-GRF complexes in oocytes. Oocytes were injected with 2.5 ng cRNA of the dSA or dSD forms of cYFP-PIP2;1 in the absence (H2O) or presence of 2.5 ng cRNA of CIPK10, AtPIP2;1, GRF4, or GRF10 fused to NYFP. Oocytes expressing dSA or dSD and GRF linked by BiFC are shown and compared with oocytes injected with H2O. CIPK10-NYFP and NYFP-PIP2;1 were used as negative and positive controls, respectively, for fluorescence complementation with the forms of cYFP-PIP2;1. Representative data from one batch of oocytes are shown, with each bar representing mean + se from 5 to 10 oocytes. The significance of fluorescence complementation was tested using ANOVA with a generalized linear model followed by a simultaneous test for general linear hypotheses taking the H2O series as a reference (NS, not significant; **P < 0.01; ***P < 0.001). Note that the data sets for dSA cYFP-PIP2;1 and dSA cYFP-PIP2;1 were acquired independently and cannot be compared. A.U., arbitrary units.

