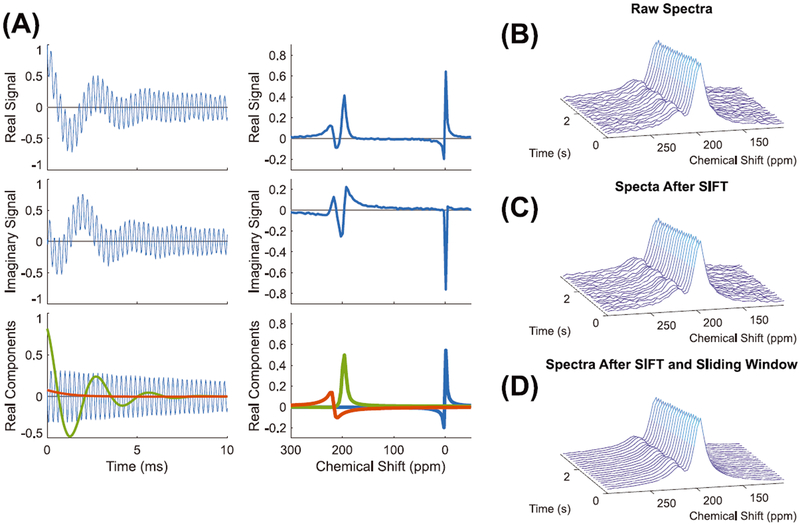
FIGURE 1.
A, The real and imaginary components for a raw FID and spectrum along with the real components of the associated spectroscopic fitting. B-D, Consecutive spectra before SIFT (B), after SIFT (C), and after sliding window averaging (D). The raw spectra have an SNR of 10.7, which was increased to 12.3 using SIFT and further enhanced to 15.0 after sliding window averaging

