
Fig 2.
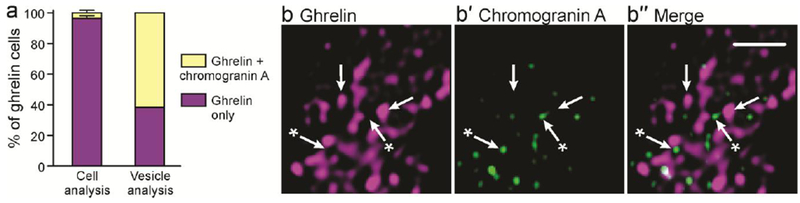
a: Contrast of the quantitative colocalisation of ghrelin and chromogranin A. Using cell level analysis, only ghrelin was detected in most cells, whereas a super-resolution vesicle analysis revealed chromogranin A in over 50% of ghrelin immunoreactive cells. Subcellular stores of ghrelin (b) and small numbers of chromogranin A vesicles (b′) are observed using super-resolution microscopy. Arrows indicate vesicles that contain ghrelin, and arrows with an asterisk indicate vesicles that contain chromogranin A. Scale bar: 1μm.