
Figure 1. LD50 analysis reveals physiologies associated with co-operative defenses.
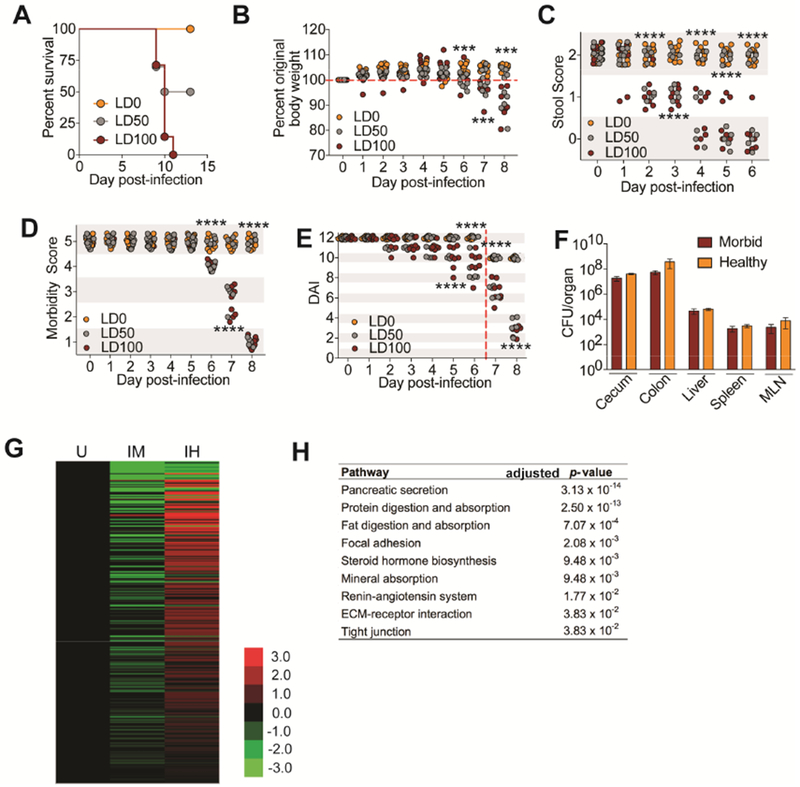
(A-E) C3H/HeJ mice orally infected with an LD0 (n=10), LD50 (n=10) or LD100 (n=8) dose of CR. (A) Survival (B) Weight loss (C) Stool scores (D) Morbidity scores (E) Daily disease activity index scores. Beginning at day 7 post-infection, stool score was no longer used to generate a DAI because sick animals stopped pooping. Red dashed line indicates this. (F) CFU analysis of from healthy and morbid mice challenged with an LD50 dose of CR at day 8 post-infection. n=5 per condition. (G) Average log2fold FPKM expression of genes significantly up in livers from infected healthy (IH) compared to infected morbid (IM) (log2fold > 1, FDR < 0.01) normalized to uninfected (U) control, n=3 mice per condition. (H) Top KEGG pathways showing overrepresentation of genes up in IH compared to IM. Data from (A-F) ***p<.001, ****p<0.0001. In (B) asterisk indicate significance between LD50 animals with >100% original weight compared to LD50 animals <100% original weight. In (C) asterisks indicate significance between LD50 animals with 2 stool score compared to LD50 animals with <2 stool score. In (D) asterisk indicate LD50 mice with morbidity score of 5 compared to LD50 mice with score <5. In (E) asterisk indicate LD50 mice with DAI of 12 (or 10 beginning day 7) compared to LD50 mice <12 (or 10). Error bars +/− SEM.