
Figure 6. Iron induced insulin resistance is necessary and sufficient for protection from CR.
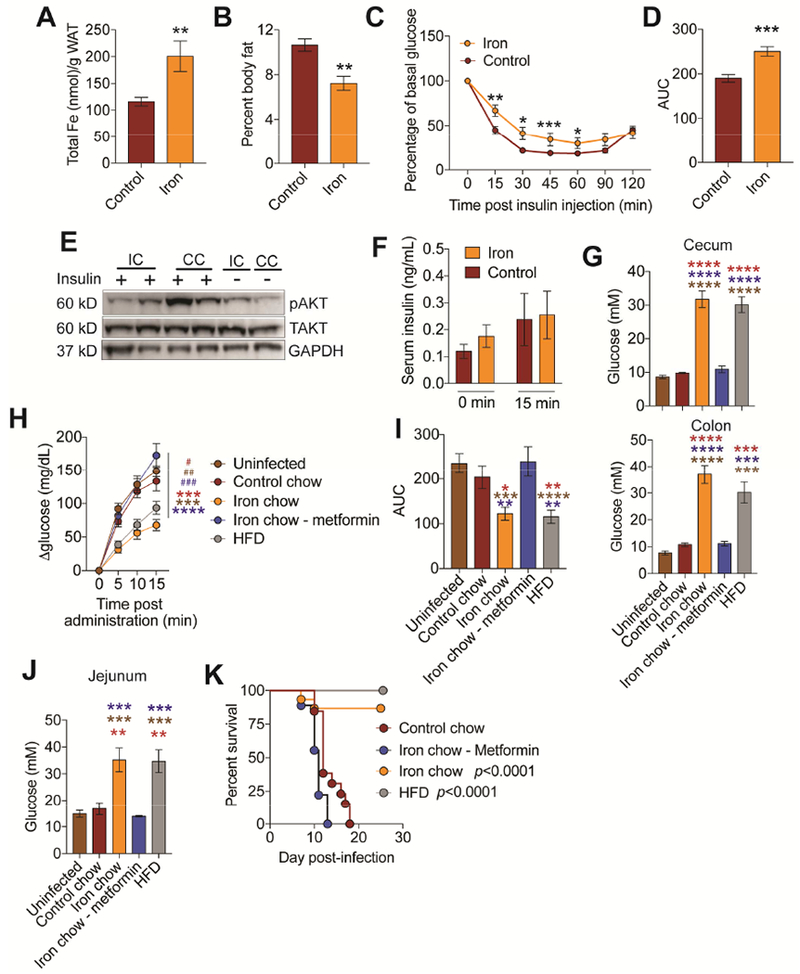
(A-F) C3H/HeJ mice were orally infected with an LD100 dose of CR and fed control or iron chow and (A) WAT iron content (n=12 mice/condition) (B) percent body fat (n=5 mice/condition) (C-D) insulin tolerance test (n=10 mice/condition) (E) insulin signaling in WAT and (F) circulating insulin levels (n=10 mice/condition) at day 3 post-infection. (G) Luminal glucose concentration of cecum and colon from mice orally infected with LD100 dose of CR and given stated diet treatment. (n=3-5 mice per condition). (H) Infected mice fed control (n=20), iron chow (n=18), iron chow plus metformin (n=21), high fat diet (HFD, n=22) were gavaged with glucose at day 3 post-infection and the change in blood glucose levels were measured. Uninfected (n=28) (I) Area under the curve analysis of mice from (H). (J) Glucose levels in the jejunum luminal content of infected and uninfected mice given stated treatment (n=3-5 mice/condition). (K) Survival of infected mice given control chow (n=13), iron chow (n=15), iron chow plus metformin (n=9) or raised on HFD and given normal chow during infection (n=15). p values in K represent iron chow compared to control chow and iron chow/metformin and HFD compared to control chow and iron chow/metformin*p<0.05, **p<0.01, ***p=0.0005, ****p<0.0001. In (G, I, J) red * indicate comparison between to control chow. brown * indicates comparison to uninfected and blue * indicates comparison to iron chow-metformin. In (H) * indicates comparison between iron and other conditions. # indicates comparison between HFD and other conditions. Related to Figure S5 and S6.