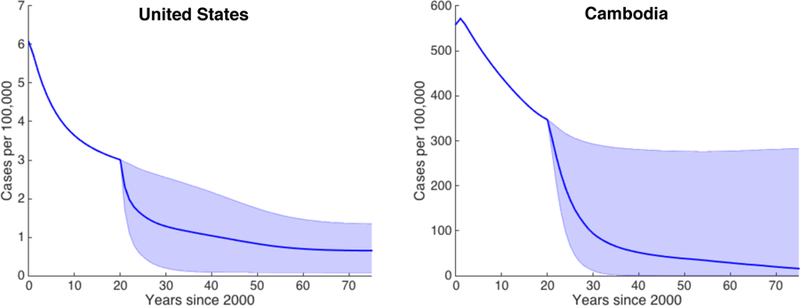
Figure 5: TB incidence in the US and Cambodia under constant vaccination.

Simulated case rates for the US (left) and Cambodia (right) from the year 2000 to 2075 for constant vaccination parameters within the ranges in Table 4. Vaccination is started at t = 20. The blue line indicates the median case rate and the shaded region indicates the full range of case rates obtained via 1,000 LHS samples.
