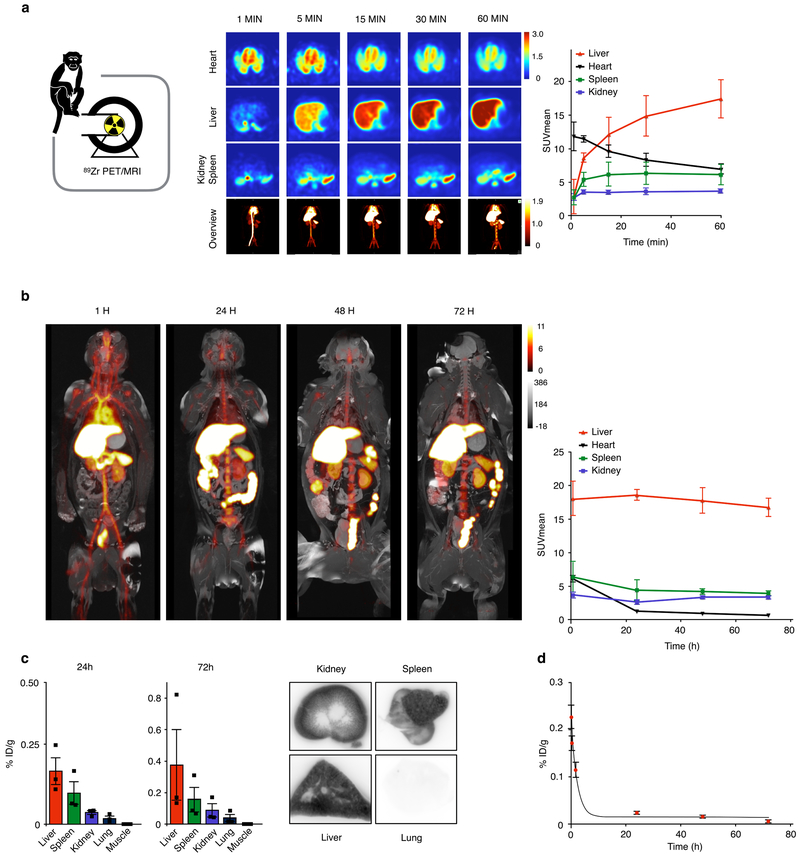
Figure 2. TRAF6i-HDL biodistribution in non-human primates.
Six non-human primates were infused with 89Zr-labeled TRAF6i-HDL (1 mg/kg). Dynamic PET images were acquired within 60 minutes after infusion. Static PET/MRI scans were performed at 24, 48 and 72 hours (See Supplementary movie 1 for three-dimensional rendered MRI data). NHP were sacrificed after 72 hours. Organs were collected for ex vivo analysis. (a) Dynamic PET images at 1, 5, 15, 30 and 60 minutes (n=3). Images are split up to visualize liver and other organs separately. The graph shows the quantified uptake in the represented organs at the different time points (See Supplementary movie 2 for a 3D representation of the distribution at 60 min). (b) Static PET/MR images at 24, 48 and 72 hours show the distribution and accumulation of TRAF6i-HDL. The graph shows the quantified uptake in the represented organs at the different time points (n=3 per timepoint). (c) Gamma counting distribution in NHPs at 24 and 72 hours post administration of 89Zr-TRAF6i-HDL (n=3). Bars represent the mean. (d) Blood time-activity curve for 89Zr-TRAF6i-HDL in non-human primates (n=3 per timepoint). Bars represent the standard error of the mean.

