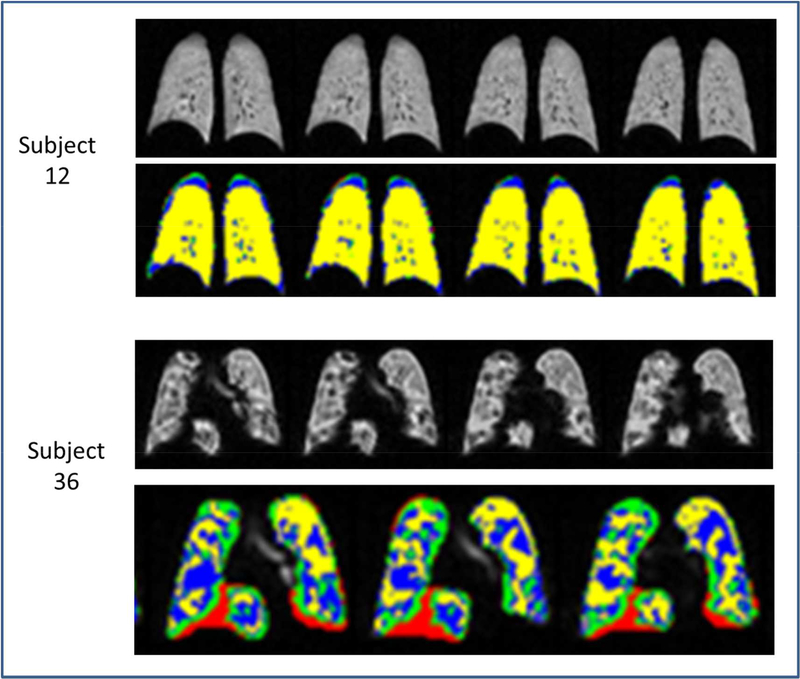
Figure 2.
Coronal hyperpolarized 3He lung MRI slices in two children with asthma. The gray scale images are shown above the corresponding labeled images which have undergone automated analysis of the 3He signal intensity. The ventilation defect volume is labeled black on the gray scale images and red on the automated images, the hypoventilated volume is gray on the gray scale images and green on the automated images, the ventilated volume is white on the gray scale images and blue on the automated images, and the well-ventilated volume is bright white on the gray scale images and yellow on the automated images. Subject 12 has mild to moderate asthma and normal lung function. The gray scale images show primarily white to bright white regions and the automated images show mostly yellow regions. This subject had a relatively low defect volume to total lung volume ratio of 0.3% Subject 36 by contrast has severe asthma, with significant airflow obstruction at baseline. The MRI shows visible contrasts in both the gray scale and automated images. Note the relative abundance of red and green regions on the automated images compared to subject 12. This subject had a relatively high defect volume to total lung volume ratio of 8.6%.

