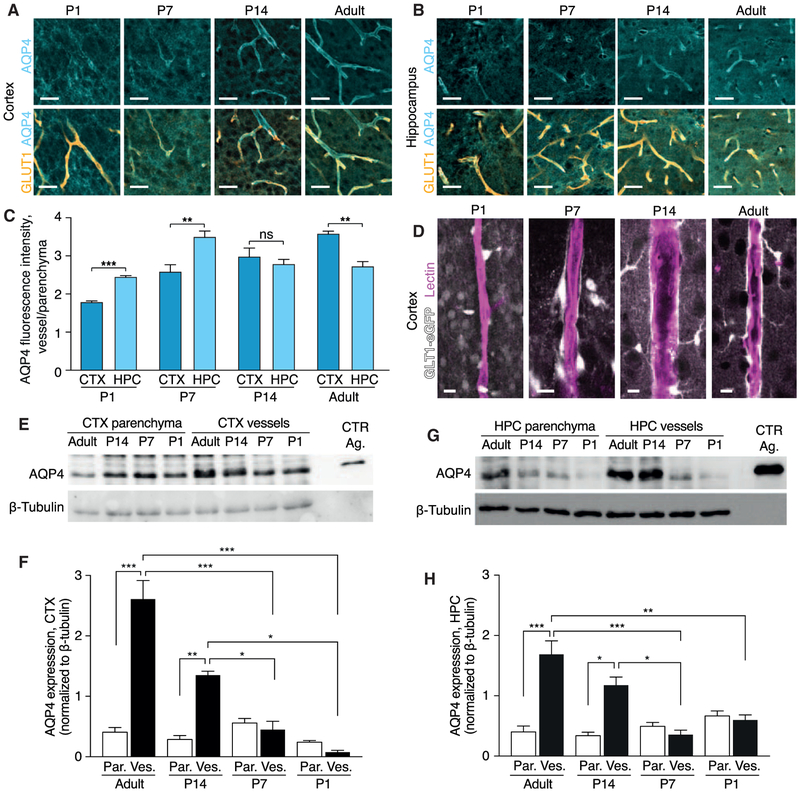
Figure 3. AQP4 Expression and Polarization Develop Early in the Hippocampus.
(A and B) Representative confocal images of immunohistochemistry of aquaporin 4 (AQP4; cyan) and blood vessels stained for glucose transporter 1 (GLUT1; orange) at postnatal day (P) 1, P7, P14, and adult mice in (A) cortex and (B) hippocampus. Scale bars, 100 μm.
(C) Quantification of AQP4 polarization measured as the ratio of signal around the blood vessel divided by the signal in the surrounding parenchyma. Comparisons between cortex and hippocampus were performed using Student’s t test. N = 4, 6, 4, and 4 for P1, P7, P14, and adult mice, respectively.
(D) Representative confocal images of lectin-labeled blood vessels and GTL1-eGFP-positive astrocytes in P1, P7, P14, and adult mouse cortex showing that astrocyte vascular endfeet development by P7. Scale bars, 10 μm.
(E–H) Representative western blot (E) and quantification (F) of AQP4 protein and β-tubulin in parenchymal and vessel isolation fraction in the cortex and (G and H) in the hippocampus. CTX, cortex; HPC, hippocampus; Par, parenchyma; Ves, vessel isolation fraction; CTR Ag, control antigen. N = 6, 5, 4, and 3 for adult, P14, P7, and P1 mice, respectively.
*p < 0.05, **p < 0.01, and ***p < 0.001 (two-way ANOVA with Tukey post-test). Bar graphs represent mean ± SEM.

