Figure 2.

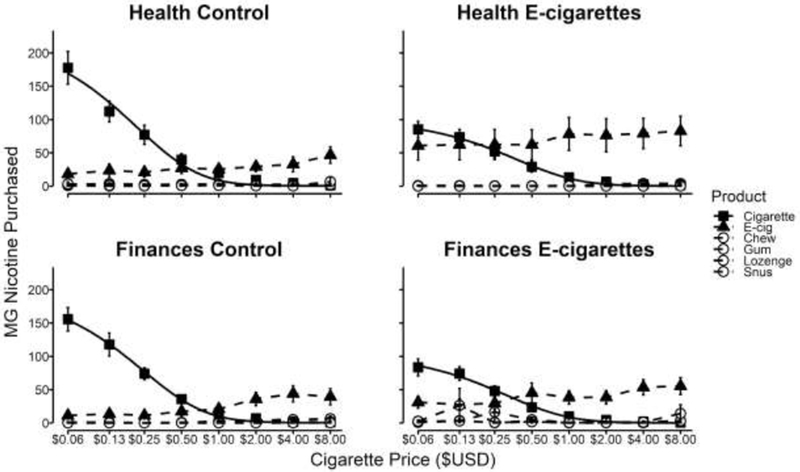
Experiment 2 ETM results for each narrative group. Solid black lines depict the Equation 1 model fit to mg of nicotine purchased at each cigarette price point. x-axis is scaled in log units.

Experiment 2 ETM results for each narrative group. Solid black lines depict the Equation 1 model fit to mg of nicotine purchased at each cigarette price point. x-axis is scaled in log units.