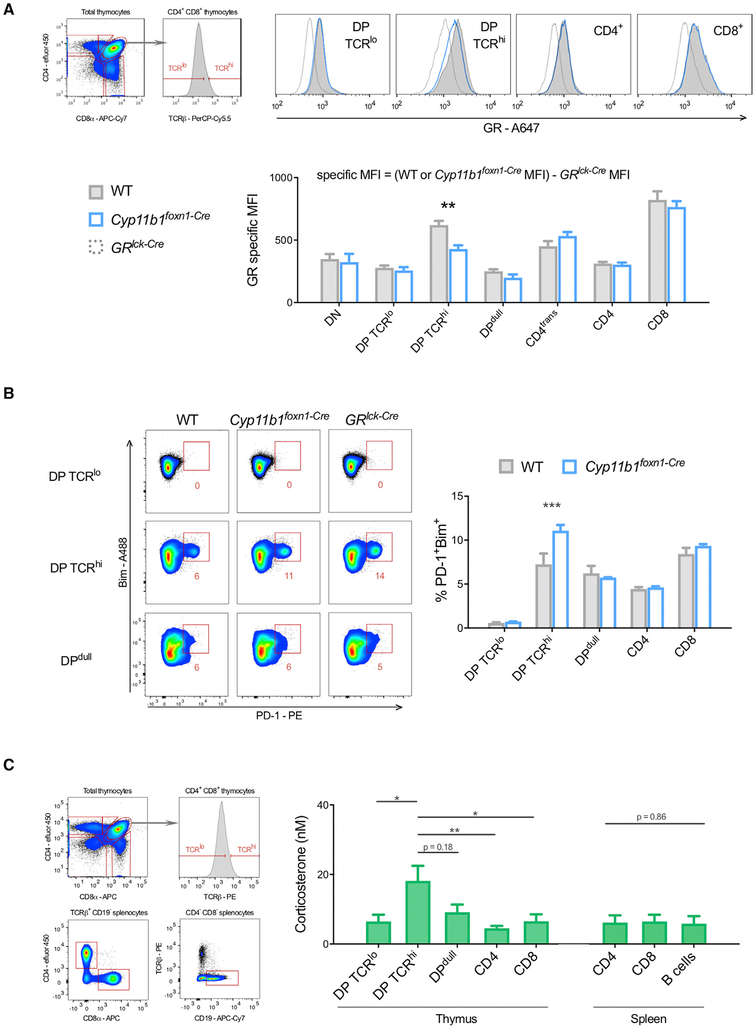
Figure 7. Targeted Delivery of TEC-Derived Glucocorticoids in the Thymus.
(A) Thymi were collected from neonatal WT (n = 6) and Cyp11b1foxn1-Cre (n = 3) littermates; cells were perm-fixed, GR stained, and surface markers stained, and data were acquired by flow cytometry. Specific MFI is the result of subtracting the non-specific staining of the same thymocyte subpopulation from GRlck-Cre mice, which lack GR expression (WT or Cyp11b1foxn1-Cre MFI − GRlck-Cre MFI). Data are representative of three independent experiments. CD4trans, transitional (CD4+CD8lo); DN, CD4−8−; DP, CD4+8+; DPdull, CD4lo8lo; ISP, immature single positive (CD8+TCR−).
(B) Thymi were collected from WT (n = 3) and Cyp11b1foxn1-Cre (n = 3) immediately after disturbance, cells dispersed, surface markers stained, fixed, permeabilized, intracellular proteins stained, washed, and data acquired by flow cytometry. Subsets were compared using a two-way ANOVA and Sidak’s test for multiple comparisons. DP, CD4+8+; DPdull, CD4lo8lo.
(C) Thymus and spleen were collected from mice (n = 6) immediately after disturbance, cells dispersed, and aliquots immediately incubated with a range of corticosterone concentrations for 7.5 min, perm-fixed, stained, and data acquired by flow cytometry. The corticosterone concentrations shown in the bar graph were calculated as described in STAR Methods, and subsets were compared using a Kruskal-Wallis test and Dunn’s test for multiple comparisons.
DP, CD4+8+; DPdull, CD4lo8lo.
All bar graphs show means ± SEM with significance indicated by *p < 0.05, **p < 0.01, and ***p < 0.001.
See also Figure S3.

